
Figures & data
Figure 1 A flowchart of chronic lung disease in the northern region.
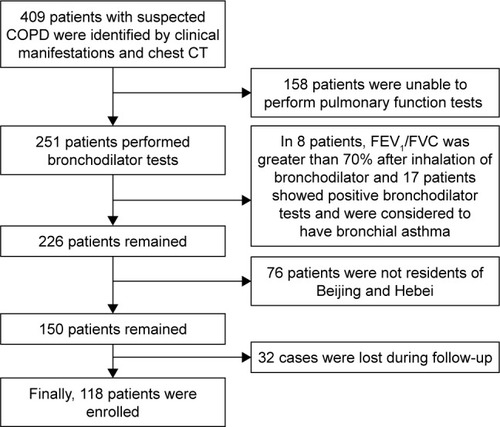
Table 1 Baseline information for all subjects
Table 2 Sequencing data statistics
Figure 2 The common and specific sequence statistics in the Beijing group (B) and the migratory group (H).
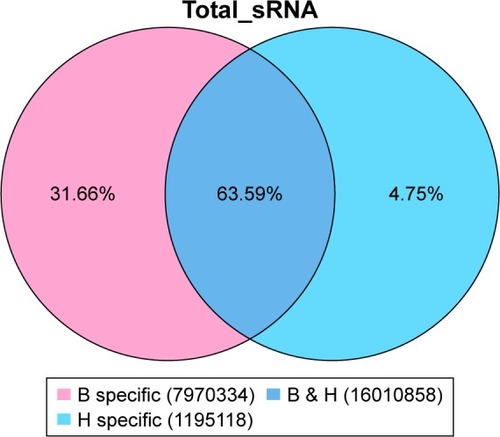
Figure 3 The common and specific sequence statistics in the Beijing group (B) and the healthy control group (D).

Figure 4 The common and specific sequence statistics in the migratory group (H) and the healthy control group (D).
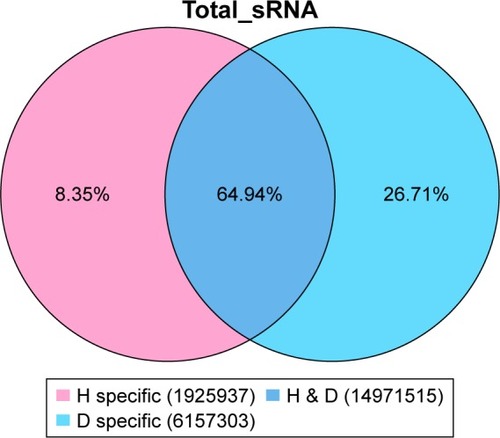
Table 3 A total of 119 differentially expressed miRNAs
Table 4 Nine differentially expressed miRNAs
Figure 5 Nine differentially expressed miRNAs (A–C).
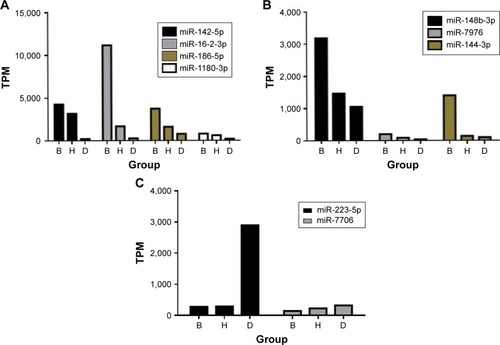
Table 5 The baseline information for patients with COPD in the Beijing group
Figure 6 The difference in baseline CAT scores between AQI ≤100 and AQI >100.
Abbreviations: AQI, air quality index; CAT, chronic obstructive pulmonary disease assessment test.
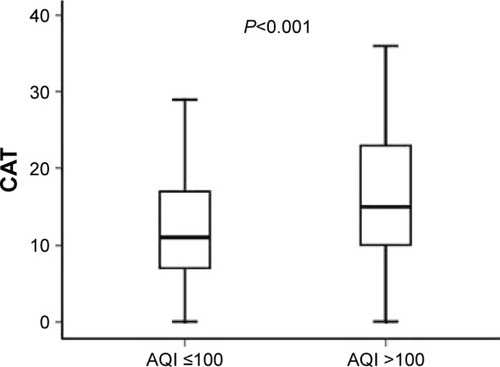
Figure 7 The difference in baseline mMRC scores between AQI ≤100 and AQI >100.
Abbreviations: AQI, air quality index; mMRC, Modified British Medical Research Council.
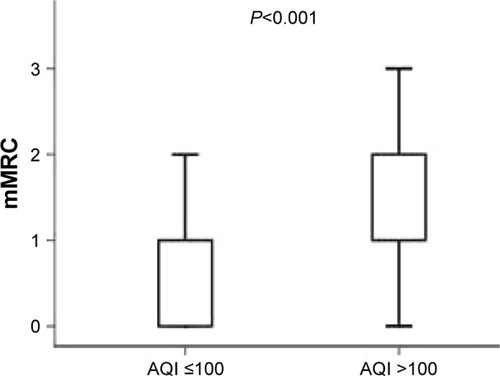
Figure 8 The difference in follow-up CAT scores between AQI ≤100 and AQI >100.
Abbreviations: AQI, air quality index; CAT, chronic obstructive pulmonary disease assessment test.
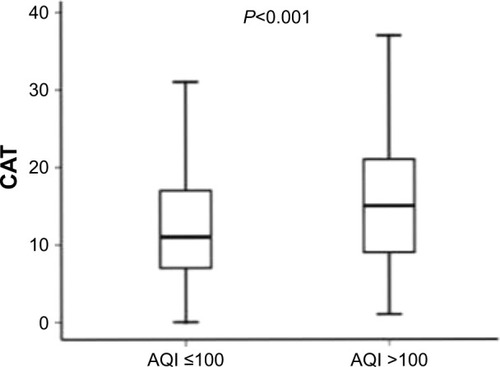
Figure 9 The difference in follow-up mMRC scores between AQI ≤100 and AQI >100.
Abbreviations: AQI, air quality index; mMRC, Modified British Medical Research Council.
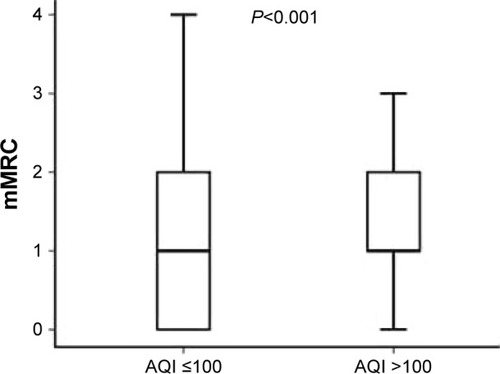
Figure 10 The difference in baseline mMRC scores and follow-up mMRC scores.
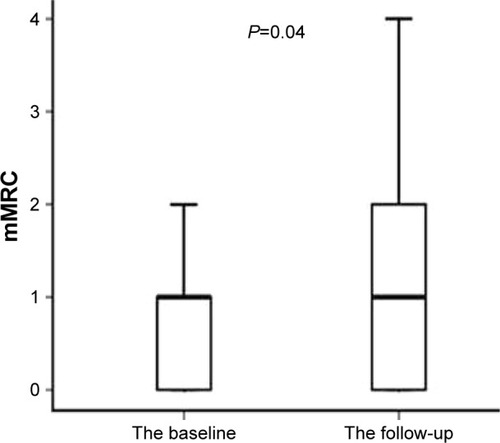
Table 6 The information for patients with COPD in different groups
Table 7 The baseline CAT score and the mMRC score between AQI ≤100 and AQI >100 in the fewer symptoms group
Table 8 The follow-up CAT score and the mMRC score between AQI ≤100 and AQI >100 in the fewer symptoms group
Table 9 Baseline acute exacerbations and follow-up acute exacerbations in the fewer symptoms group
Table 10 The CAT and mMRC scores for the migratory population in the different regions