Figures & data
Table 1 Baseline characteristics by hospital site
Table 2 Influence of deprivation (IMD score) on 1-year health care use (n=384)
Table 3 Influence of deprivation (IMD score) on annual secondary care health care costs (£) (n=384)
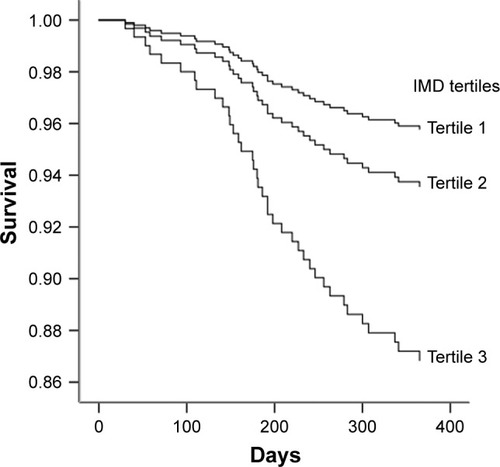
Figure 1 Cox regression analysis of 1-year survival according to tertiles of IMD score, with adjustment for age, COPD disease severity, smoking status, and malnutrition risk.
Notes: n=384; mean IMD score: 15.74 (SD 11.06; SE 0.56; 15.78) and range: 1.88–57.05; 1= least deprived tertile, 3= most deprived tertile (overall p=0.014). With tertile 3 (most deprived) as referent, HR (in comparison with tertile 1) =0.306, 95% CI 0.130–0.719. p=0.007; and HR (in comparison with tertile 2) =0.471, 95% CI 0.226–0.984, p=0.045.
Abbreviations: HR, hazard ratio; IMD, Index of Multiple Deprivation.
Abbreviations: HR, hazard ratio; IMD, Index of Multiple Deprivation.