Figures & data
Table 1 COPD comorbidity indexTable Footnote*
Table 2 Characteristics of patients hospitalized for an AECOPD, according to prolonged QTc status on the admission ECGTable Footnote*
Figure 1 Distribution of (cardiovascular) comorbidity according to prolonged QTc status in COPD patients hospitalized for an acute exacerbation, assessed by the (A) Charlson comorbidity index (p=0.034), (B) COPD comorbidity index (p=0.021) and (C) presence of cardiovascular disease (p=0.040).
Abbreviation: QTc, QT interval corrected according to Bazett’s formula.
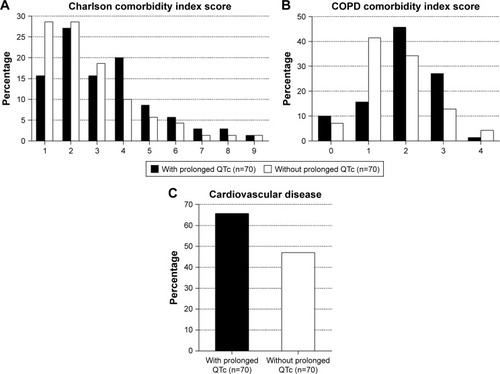
Figure 2 Distribution of cardiac troponin T value according to prolonged QTc status in COPD patients hospitalized for an acute exacerbation (p<0.001). Cutoff values: negative, ≤0.014 ng/mL; intermediate, 0.014–0.052 ng/mL; high, ≥0.052 ng/mL.
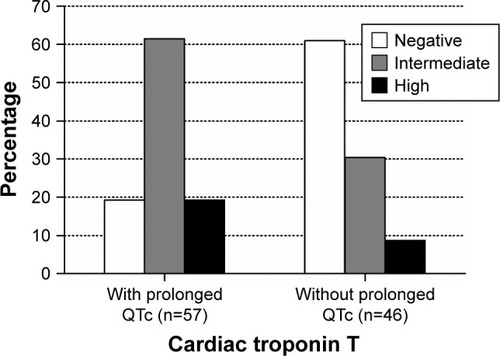
Table 3 Multivariate logistic regression model: determinants for prolonged QTc in patients hospitalized for an AECOPDTable Footnote*
Figure 3 Influence of prolonged QTc on overall survival in COPD patients hospitalized for an acute exacerbation (log rank test, p=0.035).
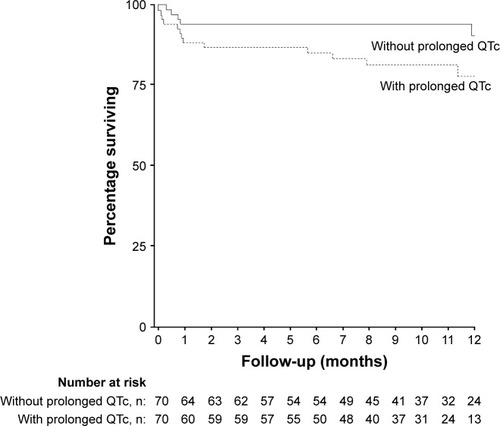
Table 4 Characteristics of pulmonary patients hospitalized for acute respiratory problems, according to the main admission diagnosisTable Footnote*
Figure 4 Distribution of the (A) concomitant use of QT-prolonging medication (p=0.004) and the (B) prevalence of prolonged QTc (p=0.858) among pulmonary patients hospitalized for acute respiratory problems according to the admission diagnosis.
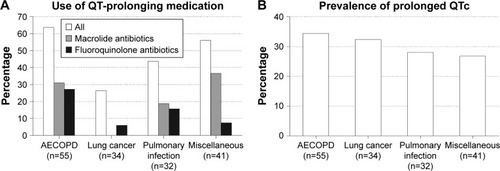
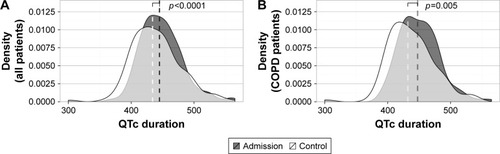
Figure 5 The median QTc duration, evaluated in (A) all pulmonary patients hospitalized for acute respiratory problems (n=160) and more specifically (B) COPD patients hospitalized for an acute exacerbation (n=123), decreases significantly during hospitalization.
Abbreviations: QTc, QT interval corrected according to Bazett’s formula; ECG, electrocardiogram.