Figures & data
Table 1 Demographics of the study population
Figure 1 The effect of ECVE and CSE on the toxicity of Calu-3 cells. Calu-3 cells (n=6) were exposed to ECVE (0.01–0.3 OD; A, B) or CSE (0.01–0.3 OD; C, D) for 24 hours before TEER (A, C) and LDH release (B, D) were measured. **Significant difference compared to untreated cells where p<0.01.
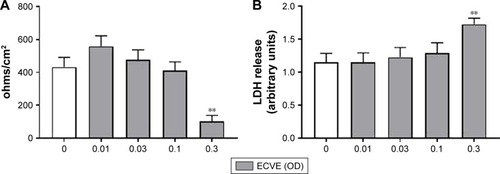
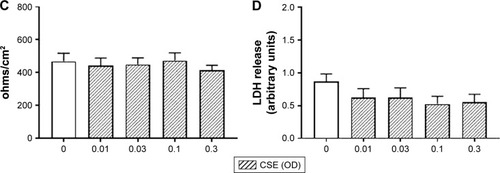
Figure 2 The effect of ECVE and CSE on the toxicity of primary BECs. Primary BECs from controls (A, B) and COPD patients (C, D) were exposed to ECVE (0.01–0.3 OD) or CSE (0.1–0.3 OD) for 24 hours before TEER (A, C) and LDH release (B, D) were measured. *, **Significant difference compared to untreated cells where p<0.05 and p<0.01, respectively.
Figure 3 The effect of ECVE on cytokine release from Calu-3 cells. Calu-3 cells (n=6) were exposed to ECVE (0.01–0.3 OD) for 24 hours and apical (A, C) and basolateral (B, D) supernatants were analyzed for IL-6 (A, B) and CXCL8 (C, D). *, **Significant difference compared to untreated cells where p<0.05 and p<0.01, respectively.
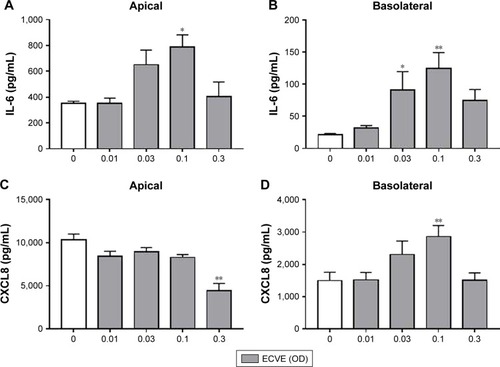
Figure 4 The effect of CSE on cytokine release from Calu-3 cells. Calu-3 cells (n=6) were exposed to CSE (0.01–0.3 OD) for 24 hours and apical (A, C) and basolateral (B, D) supernatants were analyzed for IL-6 (A, B) and CXCL8 (C, D). **Significant difference compared to untreated cells where p<0.01.
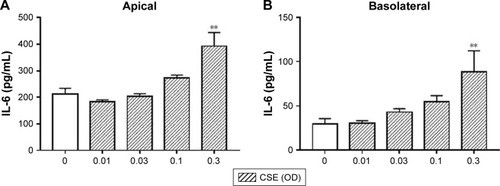
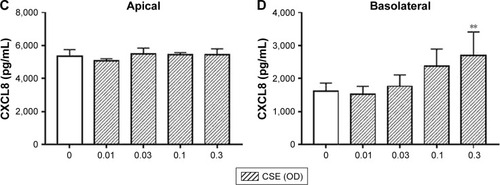
Figure 5 The effect of ECVE and CSE on cytokine release from primary BECs. Primary BECs from controls (A–D) and COPD patients (E–H) were exposed to ECVE (0.01–0.3 OD) or CSE (0.1–0.3 OD) for 24 hours and apical (A, C, E, G) and basolateral (B, D, F, H) supernatants were analyzed for IL-6 (A, B, E, F) and CXCL8 (C, D, G, H).
Figure 6 The effect of ECVE on p38 MAPK activation in Calu-3 cells. Calu-3 cells (n=3) were exposed to ECVE (0.1 OD) for 5–240 minutes before cell lysates were analyzed for phosphorylated p38 MAPK (p-p38) by Western blot. p-p38 levels were normalized to the loading control β-actin. *, **, ***Significant difference compared to untreated time-matched control where p<0.05, p<0.01, and p<0.001, respectively.
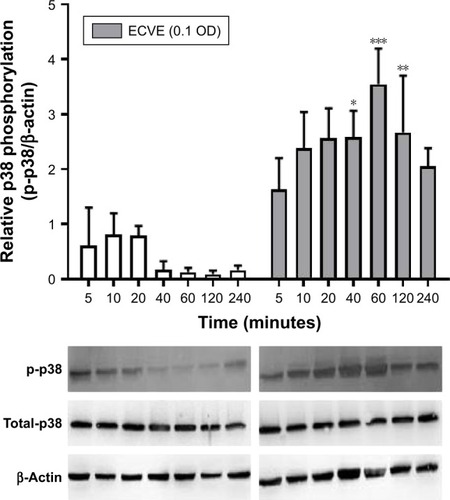
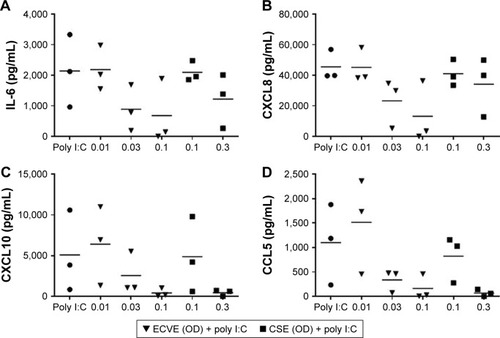
Figure 7 The effect of ECVE and CSE on poly I:C-stimulated cytokine release from Calu-3 cells. Calu-3 cells (n=3) were exposed to ECVE (0.01–0.1 OD) or CSE (0.1–0.3 OD) for 1 hour prior to poly I:C stimulation for 24 hours. Supernatants were analyzed for IL-6 (A), CXCL8 (B), CXCL10 (C), and CCL5 (D). *Significant difference compared to untreated cells where p<0.05.
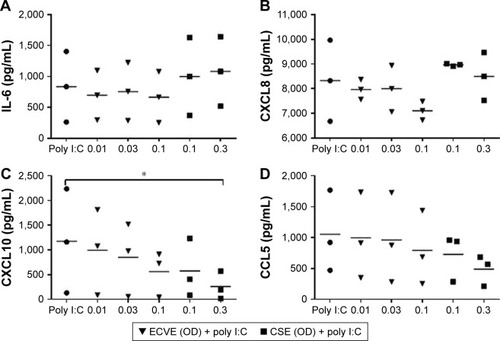
Figure 8 The effect of ECVE and CSE on poly I:C-stimulated apical cytokine release from control BECs. Primary BECs from controls were exposed to ECVE (0.01–0.1 OD) or CSE (0.1–0.3 OD) for 1 hour prior to poly I:C stimulation for 24 hours. Supernatants were analyzed for IL-6 (A), CXCL8 (B), CXCL10 (C), and CCL5 (D). *, **Significant difference compared to untreated cells where p<0.05 and p<0.01, respectively.
Abbreviations: ECVE, e-cig vapor extract; CSE, cigarette smoke extract; OD, optical density; IL, interleukin; CXCL8, C-X-C motif ligand 8; CXCL10, C-X-C motif ligand 10; CCL5, C-C motif ligand 5; poly I:C, polyinosinic:polycytidylic acid; BECs, bronchial epithelial cells.
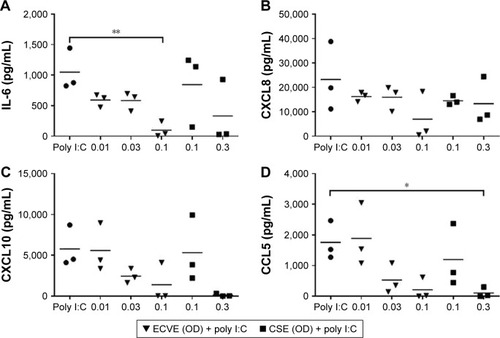
Figure 9 The effect of ECVE and CSE on poly I:C-stimulated apical cytokine release from COPD BECs. Primary BECs from COPD patients were exposed to ECVE (0.01–0.1 OD) or CSE (0.1–0.3 OD) for 1 hour prior to poly I:C stimulation for 24 hours. Supernatants were analyzed for IL-6 (A), CXCL8 (B), CXCL10 (C), and CCL5 (D).