
Figures & data
Table 1 Characteristics in COPD with symptomatic GERD (COPD + GERD) cohort and COPD alone cohort
Table 2 Rate of COPD exacerbations in COPD + GERD cohort and COPD alone cohort
Figure 1 Kaplan–Meier curve for cumulative risk of AECOPD in COPD patients.
Note: There was a statistically significant difference between the COPD with symptomatic GERD and COPD alone curves (log-rank test, p<0.0001).
Abbreviations: AECOPD, acute exacerbation of COPD; GERD, gastroesophageal reflux disease.
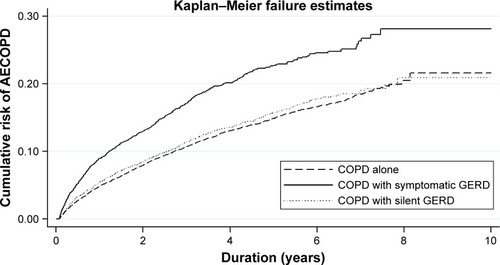
Figure 2 Kaplan–Meier curve for survival probability in COPD patients.
Abbreviation: GERD, gastroesophageal reflux disease.
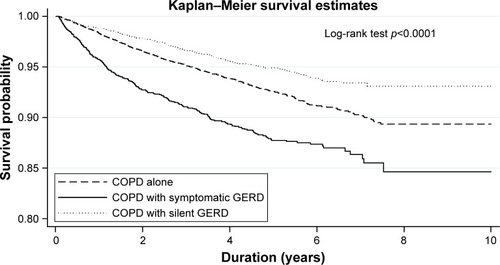
Table 3 Association between PPIs/H2RAs use and risk of acute exacerbation and mortality in COPD with symptomatic GERD
Table 4 Association between PPIs/H2RAs use and risk of acute exacerbations and mortality in patients with COPD