
Figures & data
Figure 1 Flowchart of the study population.
Abbreviations: CT, computed tomography; FEV1, forced expiratory volume in 1 second; FVC, forced vital capacity; GOLD, Global Initiative for Chronic Obstructive Lung Disease; PMF, progressive massive fibrosis; TB, tuberculosis.
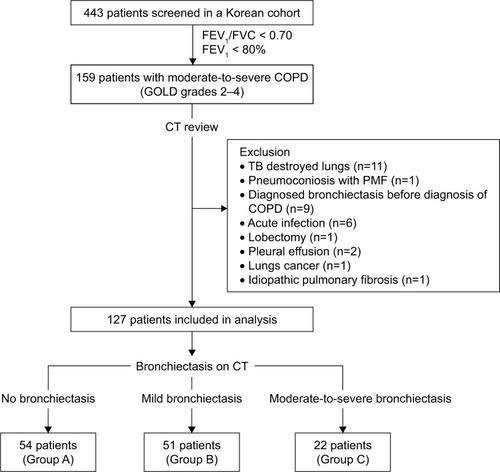
Figure 2 Quantitative CT analysis of emphysema and bronchial wall thickness.
Notes: (A) CT attenuation masks show areas of less than −950 HU (green areas). (B) Cross-sectional image shows segmentation of the airway wall at the origin of left apicoposterior segmental bronchi.
Abbreviations: CT, computed tomography; HU, Hounsfield unit.
Abbreviations: CT, computed tomography; HU, Hounsfield unit.
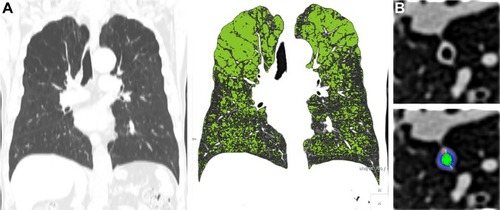
Table 1 Factors associated with bronchiectasis in a logistic regression model (adjusted for sex, smoking, and BMI)
Figure 3 Distribution of bronchiectasis.
Note: The left lingua was considered an independent lobe.
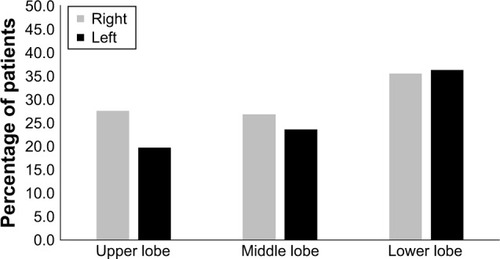
Table 2 Characteristics of 127 patients in association with the extent of bronchiectasis
Table 3 Factors associated with mild bronchiectasis in a logistic regression model (adjusted for sex, smoking, and BMI)
Table S1 The interview questionnaire
Table S2 Demographics of moderate-to-severe COPD patients with or without bronchiectasis