
Figures & data
Table 1 Characteristics of the study population
Figure 1 Overall prevalence of COPD phenotypes in 1,610 patients with COPD (percentages and 95% CI in parenthesis).
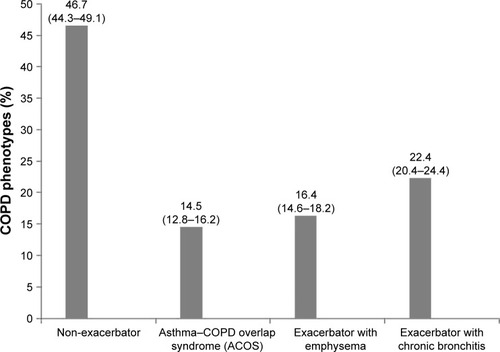
Figure 2 Geographic distribution of the prevalence of the non-exacerbator COPD phenotype showing the highest prevalence rates in the Canary Islands, Castilla-La Mancha, and the Basque Country.
Note: Courtesy of http://d-maps.com/carte.php?num_car=2210&lang=es.
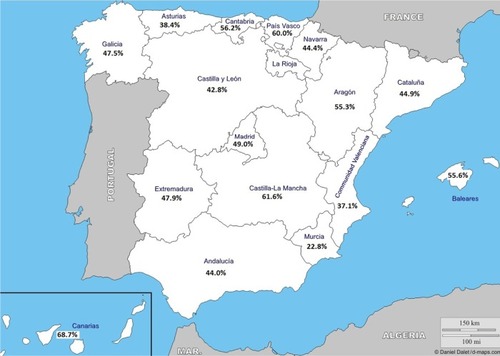
Figure 3 Geographic distribution of the prevalence of the asthma–COPD overlap syndrome (ACOS) phenotype, with Murcia, Valencia, and Navarra showing the highest prevalence rates.
Note: Courtesy of http://d-maps.com/carte.php?num_car=2210&lang=es.
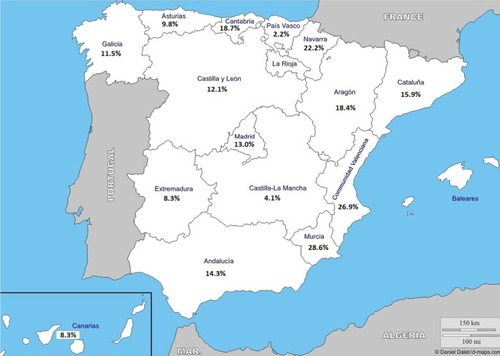
Figure 4 Geographic distribution of the prevalence of the exacerbator phenotype with emphysema. The highest prevalence rate in Asturias followed by Cataluña, Extremadura, and Andalucía.
Note: Courtesy of http://d-maps.com/carte.php?num_car=2210&lang=es.

Figure 5 Geographic distribution of the prevalence of the exacerbator phenotype with chronic bronchitis showing the highest prevalence rate in Castilla-León, Balearic Islands, and Madrid.

Table 2 Comparison of COPD phenotypes according to the study variables