Figures & data
Table 1 Clinical conditions for the tissue donors
Table 2 Primers used for the determination of genes’ expression
Figure 1 Typical morphology and identification of primary cultured HASMCs.
Notes: (A) The morphology of HASMCs was spindle-shaped, with a typical “hill and valley” appearance at confluence, as observed through an inverted light microscope. (B) Immunofluorescence demonstrated that HASMCs showed positive expression of α-SMA (green); cell nuclei were stained with DAPI (blue). The contractile fibrils were as indicated by the arrow.
Abbreviations: HASMCs, human airway smooth muscle cells; α-SMA, smooth muscle α-actin; DAPI, 4′,6-diamidino-2-phenylindole.
Abbreviations: HASMCs, human airway smooth muscle cells; α-SMA, smooth muscle α-actin; DAPI, 4′,6-diamidino-2-phenylindole.
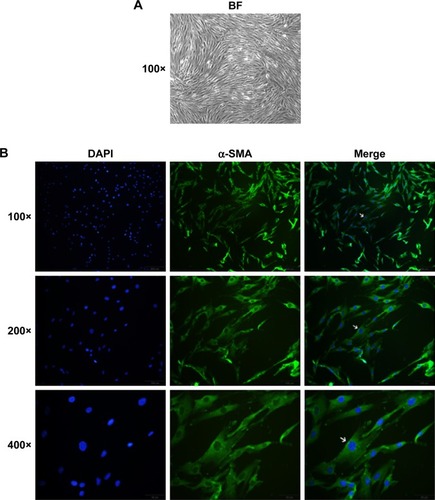
Figure 2 Tiotropium inhibits methacholine-induced ECM production in HASMCs.
Notes: (A) Western blot analysis of collagen I protein expression after exposure to increasing concentrations of methacholine from 0.1 to 10 µM for 24 hours. Collagen I expression was quantified by densitometry and normalized to β-actin expression. All values are expressed as mean ± SD (n=3). Statistical significance was determined by one-way ANOVA followed by Student–Newman–Keuls multiple comparison test. **P<0.01 versus control, ***P<0.001 versus control. (B) Western blot analysis showed the suppressive effect of different concentrations of tiotropium on methacholine-induced ECM production. Tiotropium was added 30 minutes before the addition of methacholine (10 µM). Collagen I expression was quantified by densitometry and normalized to β-actin expression. All values are expressed as mean ± SD (n=3). Statistical significance was determined by one-way ANOVA followed by Student–Newman–Keuls multiple comparison test. *P<0.05 versus control, #P<0.05 versus methacholine (Mch) group. (C) Real-time PCR analysis indicated that tiotropium decreased methacholine-induced relative mRNA expression of collagen I, fibronectin, and versican. Data represent mean ± SD of three independent experiments. Statistical significance was determined by one-way ANOVA followed by Student–Newman–Keuls multiple comparison test. **P<0.01 versus control, ###P<0.001 versus methacholine group.
Abbreviations: HASMCs, human airway smooth muscle cells; ECM, extracellular matrix; ANOVA, analysis of variance; Mch, methacholine; Tio, tiotropium.
Abbreviations: HASMCs, human airway smooth muscle cells; ECM, extracellular matrix; ANOVA, analysis of variance; Mch, methacholine; Tio, tiotropium.
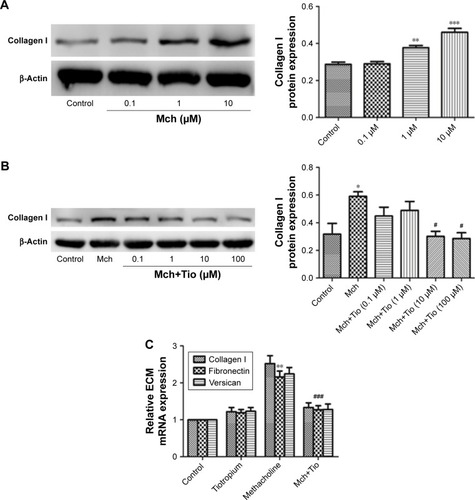
Figure 3 Tiotropium inhibits β-catenin signaling.
Notes: HASMCs were stimulated with 10 µM methacholine. Tiotropium was added 30 minutes before the addition of methacholine. (A) Increasing concentrations of tiotropium (0.1–100 µM) were added to HASMCs. Western blot analysis showed that the expression of total β-catenin was decreased by 10 µM tiotropium. Total β-catenin expression was quantified by densitometry and normalized to β-actin expression. All values are expressed as mean ± SD (n=3). (B) Increasing concentrations of tiotropium (0.1–100 µM) were added to HASMCs. Western blot analysis showed that the expression of active β-catenin was decreased by 10 µM tiotropium. Active β-catenin expression was quantified by densitometry and normalized to β-actin expression. All values are expressed as mean ± SD (n=3). (C) HASMCs were pre-exposed to 10 µM tiotropium. Real-time PCR indicated that β-catenin mRNA was downregulated. Data represent mean ± SD of three independent experiments. (D) HASMCs were exposed to methacholine after pre-stimulation with 10 µM tiotropium. GSK3β phosphorylation was inhibited by tiotropium. The expression of phosphorylated GSK3β was quantified by densitometry and normalized to GSK3β expression. All values are expressed as mean ± SD (n=3). (A–D) Statistical significance was determined by one-way ANOVA followed by Student–Newman–Keuls multiple comparison test. *P<0.05 versus control, #P<0.05 versus methacholine group.
Abbreviations: HASMCs, human airway smooth muscle cells; Mch, methacholine; Tio, tiotropium; GSK3β, glycogen synthase kinase-3β; ANOVA, analysis of variance.
Abbreviations: HASMCs, human airway smooth muscle cells; Mch, methacholine; Tio, tiotropium; GSK3β, glycogen synthase kinase-3β; ANOVA, analysis of variance.
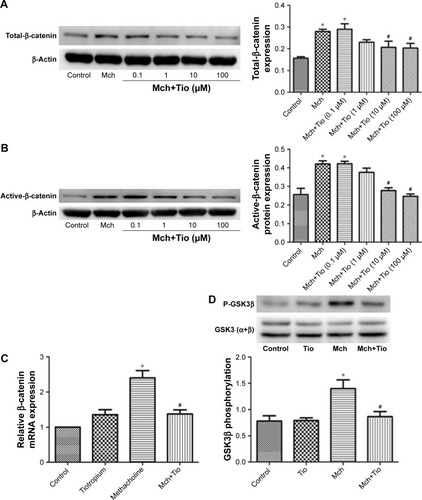
Figure 4 Tiotropium decreases the expression of active β-catenin.
Notes: HASMCs were stimulated with methacholine (10 µM) after pre-exposure to tiotropium (10 µM). (A) Western blot analysis showed the expression of active β-catenin was decreased. Active β-catenin expression was quantified by densitometry and normalized to β-actin expression. (B) Western blot analysis showed the amount of active β-catenin in the nucleus was reduced by tiotropium. Active β-catenin expression was quantified by densitometry and normalized to Lamin B1 expression. (A and B) All values are expressed as mean ± SD (n=3). Statistical significance was determined by one-way ANOVA followed by Student–Newman–Keuls multiple comparison test. *P<0.05 versus control, #P<0.05 versus methacholine group.
Abbreviations: HASMCs, human airway smooth muscle cells; Mch, methacholine; Tio, tiotropium; ANOVA, analysis of variance.
Abbreviations: HASMCs, human airway smooth muscle cells; Mch, methacholine; Tio, tiotropium; ANOVA, analysis of variance.
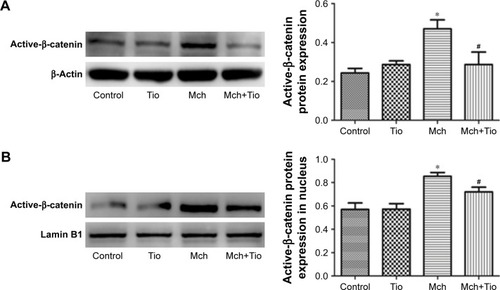
Figure 5 Overexpression of β-catenin antagonizes the effect of tiotropium on collagen I production.
Notes: (A) Representative fluorescence microscopy images showing the infection efficiency of adenoviruses carrying the S33Y-β-catenin mutant. Cells were stained for GFP (green, marker of transduction). MOI =100. (B) Real-time PCR results of β-catenin mRNA expression in cells transfected with adenoviruses carrying S33Y-β-catenin. All values are expressed as mean ± SD (n=3). Statistical significance was determined by independent t-test. **P<0.01 versus negative control (NC) group. (C) Western blot analysis showed the expression of total β-catenin after transfection of the S33Y-β-catenin mutant. Western blot analysis of active β-catenin expression (D) and collagen I protein expression in HASMCs transfected with the S33Y-β-catenin mutant (E). Active β-catenin and collagen I expression was quantified by densitometry and normalized to β-actin expression. All values are expressed as mean ± SD (n=3). Statistical significance was determined by one-way ANOVA followed by Student–Newman–Keuls multiple comparison test. *P<0.01 versus control-NC, #P<0.05 versus Mch-NC group, &P<0.05 versus control-S33Y group. There are no differences between Mch-S33Y group and (Mch+Tio)-S33Y group.
Abbreviations: GFP, green fluorescent protein; MOI, multiplicity of infection; HASMCs, human airway smooth muscle cells; Mch, methacholine; Tio, tiotropium; NC, negative control; S33Y, S33Y-β-catenin mutant.
Abbreviations: GFP, green fluorescent protein; MOI, multiplicity of infection; HASMCs, human airway smooth muscle cells; Mch, methacholine; Tio, tiotropium; NC, negative control; S33Y, S33Y-β-catenin mutant.
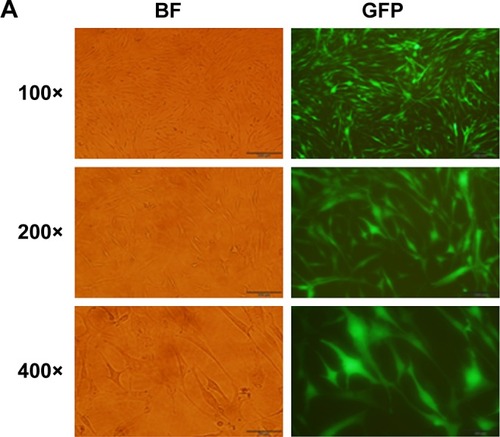
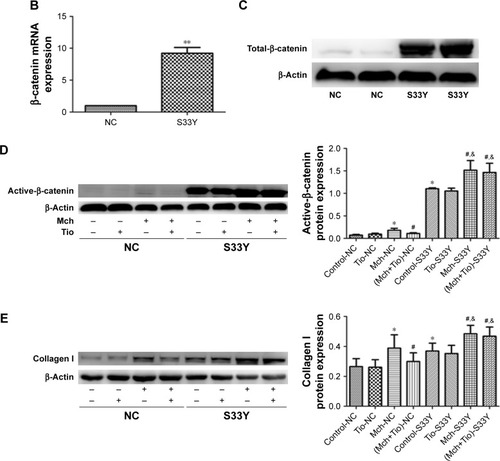
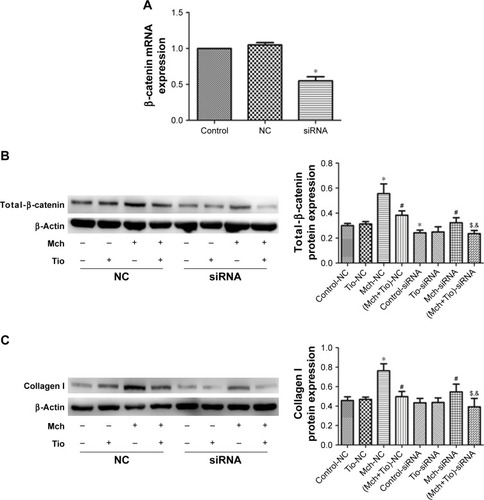
Figure 6 The effect of β-catenin silencing on the tiotropium-induced inhibition of collagen I production.
Notes: (A) Real-time PCR demonstrated the silencing efficiency of specific β-catenin siRNA. All values are expressed as mean ± SD (n=3). Statistical significance was determined by one-way ANOVA followed by Student–Newman–Keuls multiple comparison test. *P<0.05 versus negative control (NC) group. Western blot analysis showed the expression of total β-catenin (B) and collagen I protein with specific β-catenin siRNA (C). All values are expressed as mean ± SD (n=3). Statistical significance was determined by one-way ANOVA followed by Student–Newman–Keuls multiple comparison test. *P<0.01 versus control-NC, #P<0.05 versus Mch-NC group, &P<0.05 versus (Mch+Tio)-NC group, $P<0.05 versus Mch-siRNA group.
Abbreviations: HASMCs, human airway smooth muscle cells; Mch, methacholine; Tio, tiotropium; NC, negative control; siRNA, β-catenin siRNA.
Abbreviations: HASMCs, human airway smooth muscle cells; Mch, methacholine; Tio, tiotropium; NC, negative control; siRNA, β-catenin siRNA.