Figures & data
Figure 1 Conceptual framework of model: FEV1; IND/GLY.
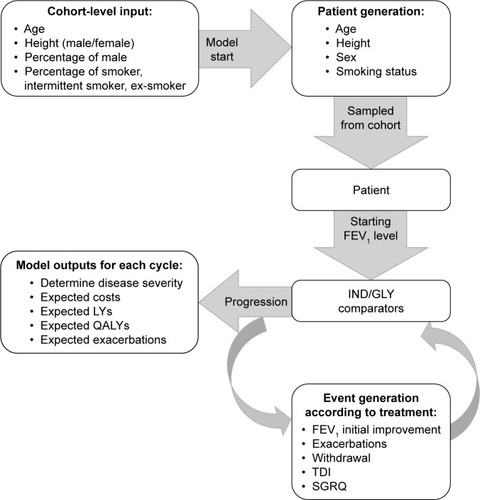
Table 1 Clinical data and utility input
Table 2 Efficacy data input
Table 3 Cost inputs
Table 4 Base-case CE results for IND/GLY versus tiotropium and IND/GLY versus SFC
Figure 2 Incremental CE scatterplot showing cost per QALY gained through the administration of IND/GLY compared to (A) tiotropium and (B) SFC.
Abbreviations: CE, cost-effectiveness; GLY, glycopyrronium; IND, indacaterol; QALY, quality-adjusted life year; SFC, salmeterol/fluticasone combination.
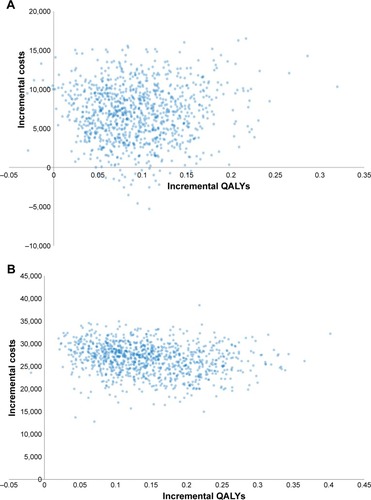
Figure 3 CEAC per QALY gained from IND/GLY.
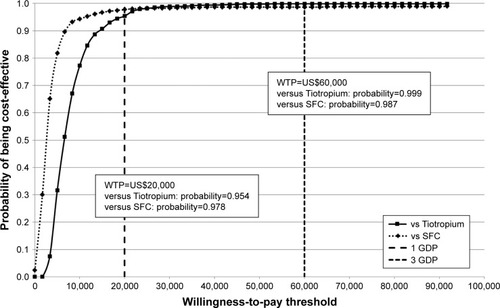
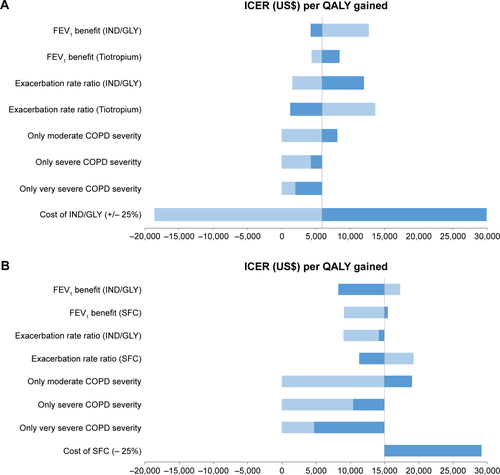
Figure S1 One-way sensitivity analysis.
Note: (A) IND/GLY versus tiotropium and (B) IND/GLY versus SFC.
Abbreviations: FEV1, forced expiratory volume in 1 second; GLY, glycopyrronium; ICER, incremental cost-effectiveness ratio; IND, indacaterol; QALY, quality-adjusted life year; SFC, salmeterol/fluticasone combination.