Figures & data
Figure 1 Subject enrollment flowchart.

Table 1 Comparison of demographic and clinical characteristics of patients with bronchiectasis when stratified by sputum culture findings
Figure 2 Microbial compositions at phyla and genera levels in patients with bronchiectasis and healthy subjects.
Abbreviations: Comm, commensals; PA, Pseudomonas aeruginosa; PPM, potentially pathogenic microorganism.
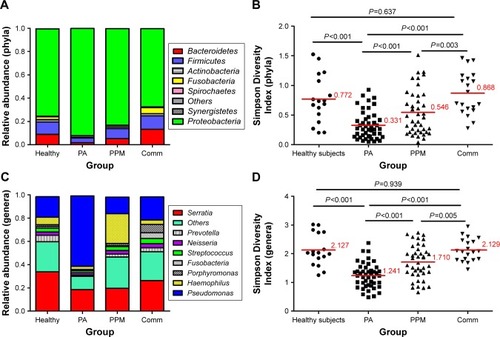
Table 2 The percentage similarity of microbial community (at genera levels) in patients with bronchiectasis when clinically stable
Figure 3 Dissimilarity of phylum Proteobacteria and its major genera in patients with bronchiectasis when clinically stable or during exacerbations.
Abbreviations: Comm, commensals; PPM, potentially pathogenic microorganism; PA, P. aeruginosa; AE, acute exacerbation; PC, principal component.
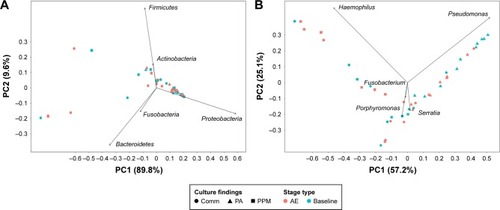
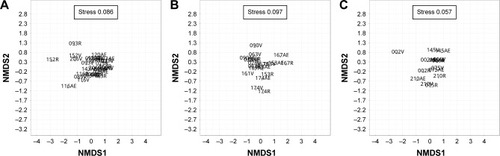
Figure 4 Pairwise comparison of Bray–Curtis distances in 17 patients with bronchiectasis (stratified by sputum culture findings) when clinically stable as well as during exacerbations and convalescence based on the non-metric multidimensional scaling analysis.
Abbreviations: Comm, commensals; PA, Pseudomonas aeruginosa; PPM, potentially pathogenic microorganism; NMDS, non-metric multidimensional scaling.