Figures & data
Figure 1 X-ray of a patient with coils in the right upper lobe.
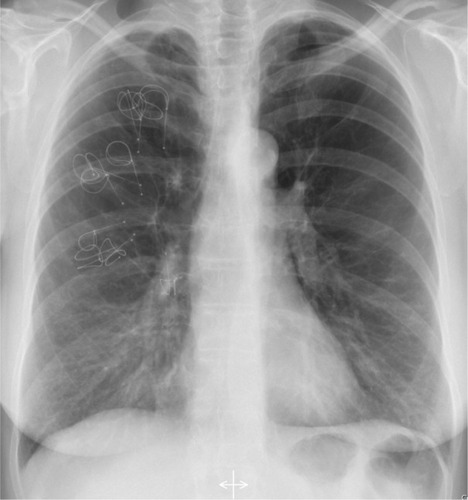
Table 1 Baseline characteristics of all patients together as well as of the responder and non-responder groups separately (A), accompanied by the response rates at 90-day follow-up (B)
Figure 2 Treatment response rates for Δ6-MWT ≥ 26 m, ΔFEV1 ≥ 12%, and ΔRV ≥ 10%.
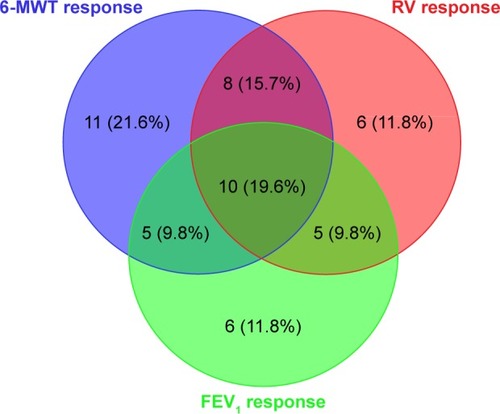
Table 2 Clinical and quantitative CT predictors of positive outcome to coils treatment
Figure 3 (A) Box plot of responders to coils treatment looking at Δ6-MWT > 26 m. Larger standard deviation of LAC sizes in peripheral regions of treated lung also responded more frequently. (B) Box plot of responders to coils treatment looking at ΔFEV1 ≥ 12%. Larger median LAC sizes in the central regions of treated lobe also responded more frequently. (C) Box plot of responders to coils treatment looking at ΔRV ≥ 10%. Larger standard deviation of LAC sizes in peripheral regions of treated lobe also responded more frequently.
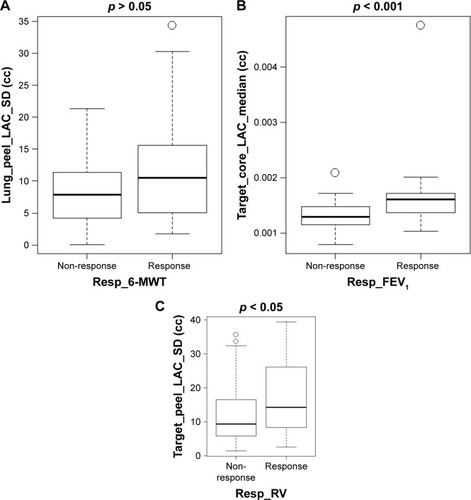
Figure 4 Lung volume reduction responder with severe emphysema treated for the right upper lobe, successfully identified as a responder by quantitative computed tomography. (A) Low-attenuation cluster representation of the patient at baseline. The low-attenuation area percentage of the right upper lobe (RUL) was found to be [LAA%] − 950 = 40.41%. (B) Three-dimensional surface lung volume reduction representation demonstrating a reduction in RUL volume of 531.3 mL after treatment, corresponding to a reduction by one-third of the baseline volume. Baseline (left) shows an enlarged RUL while post-treatment (right) shows the reduction of volume of RUL, and the relative expansion of the right middle lobe and the right lower lobe.
![Figure 4 Lung volume reduction responder with severe emphysema treated for the right upper lobe, successfully identified as a responder by quantitative computed tomography. (A) Low-attenuation cluster representation of the patient at baseline. The low-attenuation area percentage of the right upper lobe (RUL) was found to be [LAA%] − 950 = 40.41%. (B) Three-dimensional surface lung volume reduction representation demonstrating a reduction in RUL volume of 531.3 mL after treatment, corresponding to a reduction by one-third of the baseline volume. Baseline (left) shows an enlarged RUL while post-treatment (right) shows the reduction of volume of RUL, and the relative expansion of the right middle lobe and the right lower lobe.](/cms/asset/6c16a5a7-5526-4ccf-901e-0a4557d3b69b/dcop_a_159355_f0004_c.jpg)
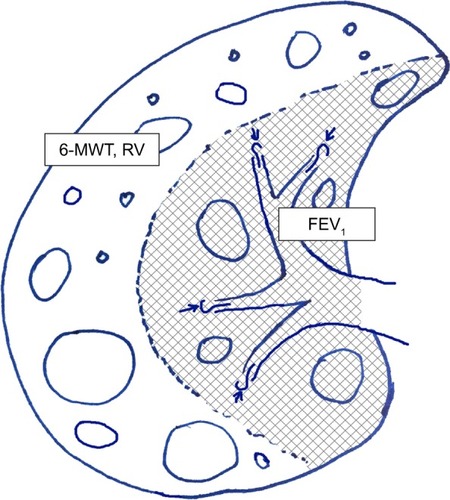
Figure 5 Importance of distribution of low attenuation clusters: central disease affects more the FEV1 while the peripheral disease affects more the hyperinflation and the exercise capacity.