
Figures & data
Table 1 Clinical and demographic characteristics of the studied subjects, classified by phenotypes
Figure 1 Kaplan–Meier survival curves for the different phenotypes.
Abbreviations: ACO, asthma–COPD overlap; EXCB, exacerbator with chronic bronchitis; EXEMPH, exacerbator with emphysema; NONEX, nonexacerbator.
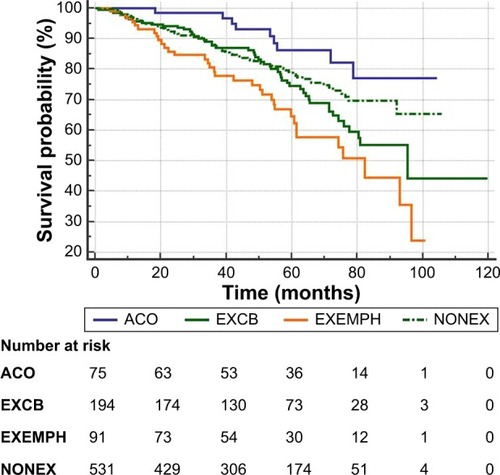
Table 2 Causes of death for the different phenotypes
Table 3 Results of the univariate and multivariate Cox proportional hazards analyses, using BODEX index
Table 4 Results of the univariate and multivariate Cox proportional hazards analyses, using BMI, FEV1%, and mMRC values