Figures & data
Table 1 Clinical characteristics of COPD patients by phenotype and control subjects who provided blood samples
Table 2 Quantification of molecules related to oxidative stress and cytokines in the blood
Table 3 Statistical analysis between groups regarding the oxidative stress molecules and cytokines reported in
Figure 1 IL-6 is significantly increased in the blood of COPD patients with prevalent emphysema (E group), prevalent airway disease (B group), and CSs compared with CNSs (A); IL-8 is significantly increased in COPD-E and COPD-B compared with CNSs (B); EGF is significantly increased in COPD patients from COPD-E and COPD-B groups compared with CNSs (C); MCP-1 is significantly increased in COPD-E compared with CSs and CNSs (D); SOD-1 is significantly decreased in COPD-E and COPD-B compared with CNSs (E); F2-IsoPs is significantly increased in both COPD-B and COPD-E groups compared with CSs and CNSs, and CSs also showed higher levels compared with CNSs (F). Bar lines represent median values.
Abbreviations: CNS, control nonsmoker; COPD, chronic obstructive pulmonary disease; CS, control smoker; EGF, epidermal growth factor; F2-IsoPs, F2-isoprostanes; IL, interleukin; MCP, macrophage chemotactic protein; SOD, superoxide dismutase.
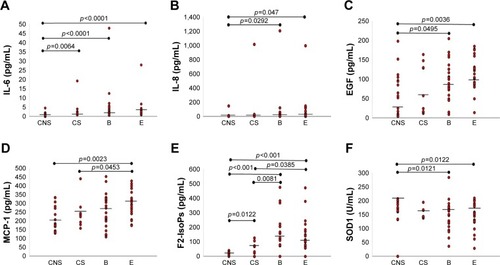
Figure 2 Regression analysis performed in all COPD patients (COPD-E and COPD-B groups) and CS and CNS groups showing correlations between F2-IsoPs and MCP-1 (A), IL-2 (B), IL-1β (C), IFN-γ (D), TNF-α (E), and SOD1 (F). All inflammatory molecules correlated positively and significantly with the oxidative stress marker F2-IsoPs. SOD1 correlated inversely and significantly with the oxidative stress marker F2-IsoPs.
Note: COPD-B, COPD patients with prevalent airway disease; COPD-E, COPD patients with prevalent emphysema.
Abbreviations: CNS, control nonsmoker; COPD, chronic obstructive pulmonary disease; CS, control smoker; F2-IsoPs, F2-isoprostanes; IFN, interferon; IL, interleukin; MCP, macrophage chemotactic protein; SOD, superoxide dismutase; TNF-α, tumor necrosis factor-α.
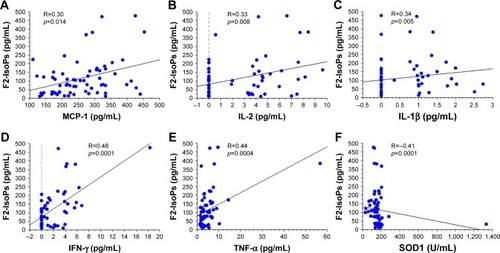
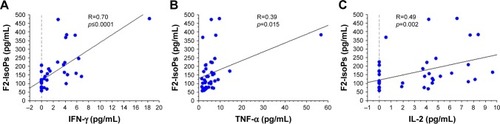
Figure 3 Regression analysis performed in all COPD patients (COPD-E and COPD-B groups) showing correlations between F2-IsoPs and IFN-γ (A), TNF-α (B), and IL-2 (C). All inflammatory molecules correlated positively and significantly with the oxidative stress marker F2-IsoPs.
Abbreviations: COPD, chronic obstructive pulmonary disease; F2-IsoPs, F2-isoprostanes; IFN, interferon; IL, interleukin; TNF, tumor necrosis factor.