Figures & data
Table 1 Demographics and clinical characteristics of the study population
Table 2 IC50, IC30, and EC50 values calculated from sigmoidal curve fitting of budesonide inhibition in PBMCs
Figure 1 Group mean budesonide and AZD7624 concentration curves in PBMCs.
Notes: The group mean data for inhibition of TNF-α (A and D), IL-6 (B and E), and IL-10 (C and F) by budesonide (A–C) and AZD7624 (D–F) are shown for HS (orange plot), COPD IFE (green plot), and COPD FE (blue plot). Data shown are mean ± SEM.
Abbreviations: COPD FE, COPD frequent exacerbators; COPD IFE, COPD infrequent exacerbators; HS, healthy smokers; IL, interleukin; LPS, lipopolysaccharide; PBMC, peripheral blood mononuclear cell; SEM, standard error of the mean; TNF-α, tumor necrosis factor-α.
Abbreviations: COPD FE, COPD frequent exacerbators; COPD IFE, COPD infrequent exacerbators; HS, healthy smokers; IL, interleukin; LPS, lipopolysaccharide; PBMC, peripheral blood mononuclear cell; SEM, standard error of the mean; TNF-α, tumor necrosis factor-α.
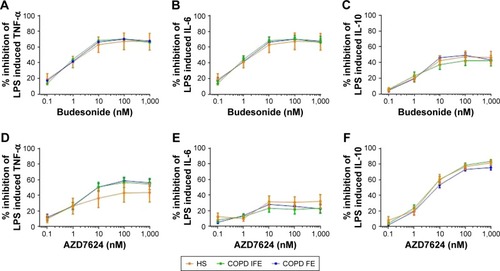
Figure 2 Group mean budesonide and AZD7624 concentration curves in alveolar macrophages.
Notes: The group mean data for inhibition of TNF-α (A and D), IL-6 (B and E), and IL-10 (C and F) by budesonide (A–C) and AZD7624 (D–F) are shown for HS (orange plot), COPD IFE (green plot), and COPD FE (blue plot). Data shown are mean ± SEM. *, ** = significant difference between HS and COPD FE where p<0.05 and p<0.01 respectively. ^ = significant difference between HS and COPD IFE where p<0.05. ¶¶, ¶¶¶ = significant difference between COPD IFE and COPD FE where p<0.01 and p<0.001, respectively.
Abbreviations: COPD FE, COPD frequent exacerbators; COPD IFE, COPD infrequent exacerbators; HS, healthy smokers; IL, interleukin; LPS, lipopolysaccharide; SEM, standard error of the mean; TNF-α, tumor necrosis factor-α.
Abbreviations: COPD FE, COPD frequent exacerbators; COPD IFE, COPD infrequent exacerbators; HS, healthy smokers; IL, interleukin; LPS, lipopolysaccharide; SEM, standard error of the mean; TNF-α, tumor necrosis factor-α.
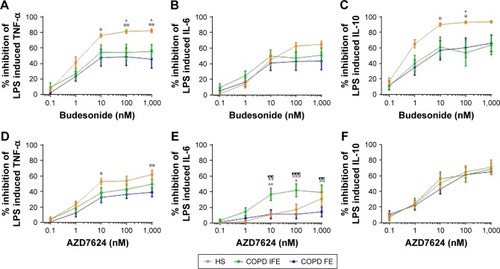
Table 3 IC50, IC30, and EC50 values calculated from sigmoidal curve fitting of budesonide inhibition in alveolar macrophages
Figure 3 Individual budesonide concentration curves in alveolar macrophages.
Notes: The individual concentration curves for budesonide inhibition of TNF-α (A–C), IL-6 (D–F), and IL-10 (G–I) by budesonide are shown for HS (A, D, and G), COPD IFE (B, E, and H), and COPD FE (C, F and I).
Abbreviations: COPD FE, COPD frequent exacerbators; COPD IFE, COPD infrequent exacerbators; HS, healthy smokers; IL, interleukin; LPS, lipopolysaccharide; TNF-α, tumor necrosis factor-α.
Abbreviations: COPD FE, COPD frequent exacerbators; COPD IFE, COPD infrequent exacerbators; HS, healthy smokers; IL, interleukin; LPS, lipopolysaccharide; TNF-α, tumor necrosis factor-α.
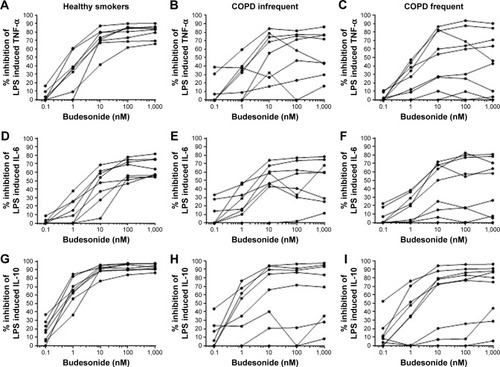
Figure 4 Correlations of budesonide cytokine inhibition.
Notes: Correlations were made between budesonide inhibition of TNF-α (A), IL-6 (B), and IL-10 (C) release from PBMCs and alveolar macrophages. Data shown are individual data points where R2 represents the coefficient of determination.
Abbreviations: IL, interleukin; LPS, lipopolysaccharide; PBMC, peripheral blood mononuclear cell; TNF-α, tumor necrosis factor-α.
Abbreviations: IL, interleukin; LPS, lipopolysaccharide; PBMC, peripheral blood mononuclear cell; TNF-α, tumor necrosis factor-α.
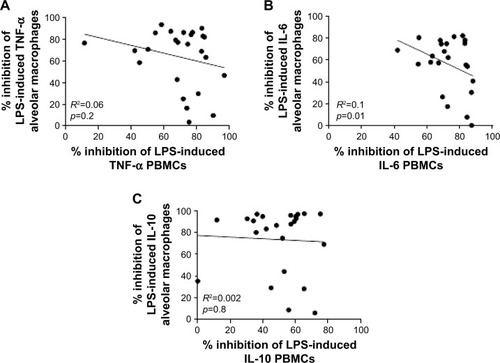
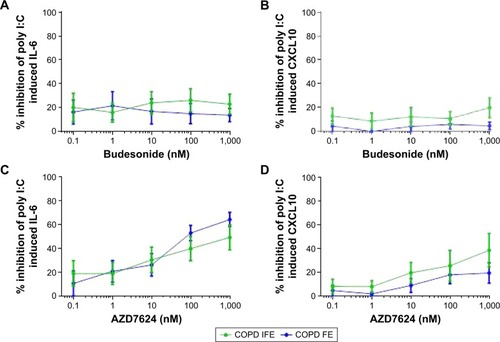
Figure 5 Group mean budesonide and AZD7624 concentration curves in BECs.
Notes: The group mean data for inhibition of IL-6 (A and C) and CXCL10 (B and D) by budesonide (A–B) and AZD7624 (C–D) are shown for COPD IFE (green plot) and COPD FE (blue plot). Data shown are mean ± SEM.
Abbreviations: BEC, bronchial epithelial cell; COPD FE, COPD frequent exacerbators; COPD IFE, COPD infrequent exacerbators; CXCL10, C-X-C motif ligand 10; IL, interleukin; SEM, standard error of the mean.
Abbreviations: BEC, bronchial epithelial cell; COPD FE, COPD frequent exacerbators; COPD IFE, COPD infrequent exacerbators; CXCL10, C-X-C motif ligand 10; IL, interleukin; SEM, standard error of the mean.