Figures & data
Table 1 Prespecified and post hoc statistical analyses
Table 2 Patient demographics and clinical characteristics at baseline based on exacerbation history in the previous year (randomized set)
Figure 1 Annualized rate of moderate or severe COPD exacerbations in different subgroups of patients based on prior exacerbations (full analysis set).
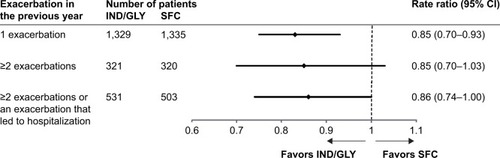
Figure 2 Kaplan–Meier plot of time to first moderate or severe COPD exacerbation in different subgroups of patients based on prior exacerbations (full analysis set).
Abbreviations: IND/GLY, indacaterol/glycopyrronium; SFC, salmeterol/fluticasone.
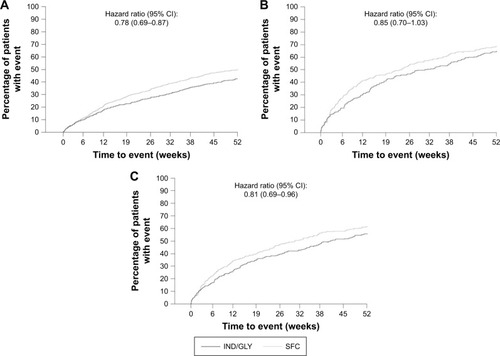
Figure 3 Annualized rate of moderate or severe COPD exacerbations based on previous treatment (full analysis set).
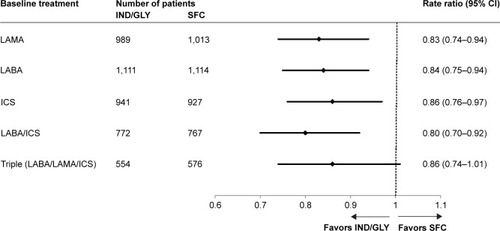
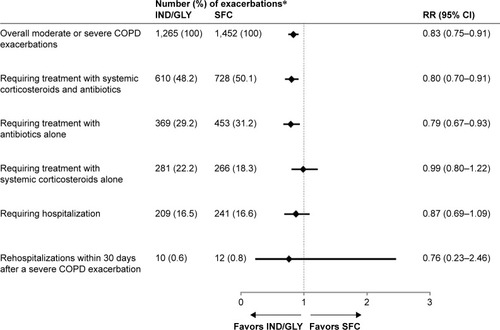
Figure 4 Number and RR of moderate or severe COPD exacerbations according to HCRU with IND/GLY versus SFC during the treatment period.
Abbreviations: HCRU, health care resource utilization; IND/GLY, indacaterol/glycopyrronium; RR, rate ratio; SFC, salmeterol/fluticasone.