
Figures & data
Table 1 Demographics of the COPD and healthy control cohorts
Table 2 Ventricular quantification, measures of PWV, and bio-markers in the healthy control and COPD cohort
Figure 1 Scatterplots of (A) aortic PWV against pulmonary PWV; (B) pulmonary PWV against RVMVR; and (C) aortic PWV against LVMVR.
Abbreviations: LVMVR, left ventricular mass/volume ratio; PWV, pulse wave velocity; RVMVR, right ventricular mass/volume ratio.
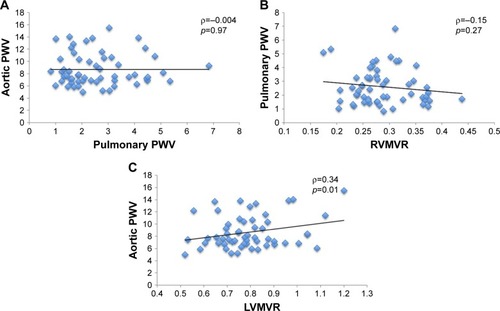
Table S1 Intra-assay and interassay CoV for the biomarkers
Table S2 Correlation coefficients between aortic PWV and pulmonary PWV and demographic and ventricular measures