Figures & data
Table 1 Demographic characteristics and inspiratory muscle performance of the psychometric testing samples
Figure 1 Graphic representation of an inspiratory effort performed using the PrO2 device software.
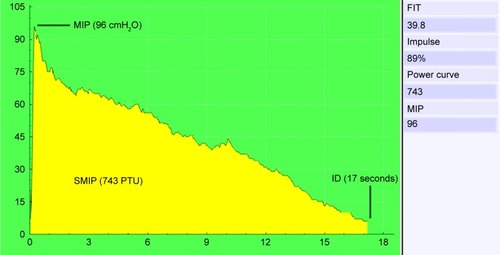
Table 2 Test–retest reliability of MIP, SMIP and ID measurements in COPD
Figure 2 Bland–Altman plot highlighting test–retest agreement in MIP (A), SMIP (B), and ID (C) values obtained using the TIRE method.
Abbreviations: ID, inspiratory duration; MIP, maximal inspiratory pressure; SMIP, sustained maximal inspiratory pressure; TIRE, Test of Incremental Respiratory Endurance.
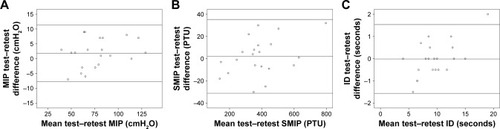
Table 3 Known-groups validity of maximal and sustained inspiratory muscle measurements in different airflow limitation groups
Figure 3 Scatter plots with lines of best fit on the relationships between MIP (left), SMIP (middle) and ID (right) with the 6MWT distance in the study sample.
Abbreviations: 6MWD, 6-minute walk distance; 6MWT, 6-minute walk test; ID, inspiratory duration; MIP, maximal inspiratory pressure; SMIP, sustained maximal inspiratory pressure.
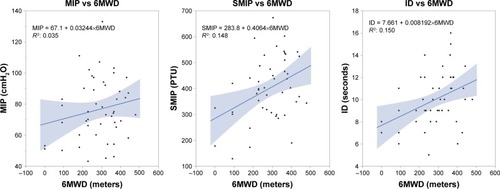
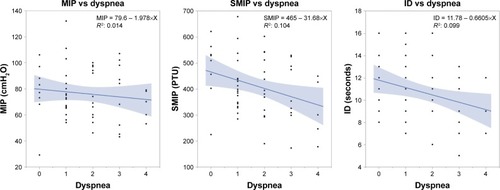
Figure 4 Scatter plots with lines of best fit on the relationships between MIP (left), SMIP (middle) and ID (right) with degrees of dyspnea in the study sample.
Abbreviations: ID, inspiratory duration; MIP, maximal inspiratory pressure; SMIP, sustained maximal inspiratory pressure.