Figures & data
Table 1 Action plan for accomplishment of the job in steps
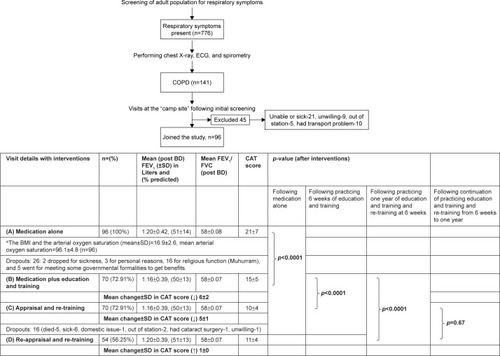
Figure 1 Details of the patients’ participation from screening to follow-up at 1 year following the initial education and training intervention
Notes: The figure elaborates the details of the patients’ participation from screening to follow-up of 1 year following the initial education and training intervention. *The BMI was 16.9±2.6 (mean±SD) and the arterial oxygen saturation was 96.1±4.8 (mean±SD). The comparative points for CAT scores are marked by “}” and the change in the score marked “(↓)” for reduction and “(↑)” for increment. Significant P-values are shown in bold.
Abbreviations: CAT, COPD assessment test; n, number; BMI, body mass index.
Abbreviations: CAT, COPD assessment test; n, number; BMI, body mass index.