Figures & data
Table 1 Baseline demographics of study participants (before switching to electronic cigarettes)
Table 2 Changes in study parameters from baseline at 12-, 24-, and 36-month follow-up visits in COPD controls and COPD EC users
Table 3 Changes in study parameters from baseline at 12-, 24-, and 36-month follow-up visits in single and dual users
Figure 1 Changes in the number of COPD exacerbations per year from baseline, at follow-up visit 1 (12±1.5 months), visit 2 (24±2.5 months), and visit 3 (36±3 months) separately for COPD EC users (closed triangles) and COPD controls (closed circles). All data are expressed as mean and error bars are standard deviation of the mean. The ** and *** indicate the within-group p-value of <0.01 and <0.001, respectively, compared to baseline.
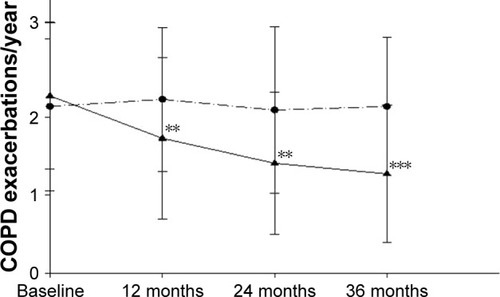
Figure 2 Changes in the FEV1 (A) and FVC (B) from baseline, at follow-up visit 1 (12±1.5 months), visit 2 (24±2.5 months), and visit 3 (36±3 months) separately for COPD EC users (dark gray boxes) and COPD controls (light gray boxes). The boxes represent the 25th to 75th percentiles; the line in the boxes indicates the median, and error bars are 5th and 95th percentiles.
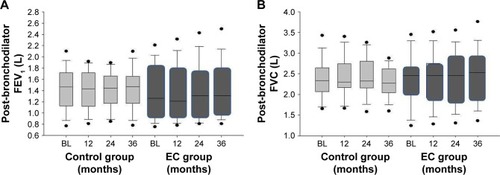
Figure 3 COPD GOLD stage changes over the study period.
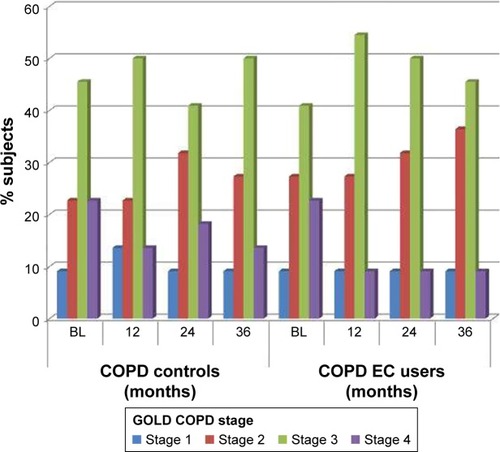
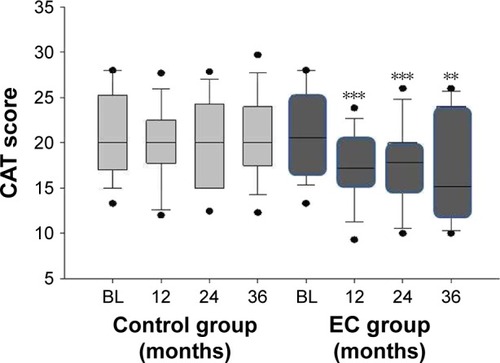
Figure 4 Changes in the CAT scores from baseline, at follow-up visit 1 (12±1.5 months), visit 2 (24±2.5 months), and visit 3 (36±3 months) separately for COPD EC users (dark gray boxes) and COPD controls (light gray boxes). The boxes represent the 25th to 75th percentiles; the lines in the boxes indicate the median, and error bars are 5th and 95th percentiles. The ** and *** indicate the within-group p-value of <0.01 and <0.001, respectively, compared to baseline.