Figures & data
Table 1 Patient characteristics and echocardiographic data for 93 patients with COPD divided into three groups by mPAP at rest and ΔmPAP/ΔCO slope
Table 2 Hemodynamic data by right heart catheterization at rest and peak exercise in 93 patients with COPD divided into three groups by mPAP at rest and ΔmPAP/ΔCO slope
Table 3 Cardiopulmonary exercise test characteristics at rest and during exercise in 93 patients with COPD divided into three groups by mPAP at rest and ΔmPAP/ΔCO slope
Figure 1 (A) First horizontal panel shows the number of COPD patients able to exercise at a specific load; from left to right the graphs present patients with normal hemodynamic response, patients with exercise-induced pulmonary hypertension, patients with pulmonary hypertension and all patients. The next panels show the development of variables during exercise for each patients, as well as the mean values represented by light blue lines for COPD-normal, red lines for COPD-EIPH, and dark blue lines for COPD-PH. With increasing load, fewer patients are represented in the presentation of the mean. (B) Development of arterial blood gases, lactate, and pH during exercise.
![Figure 1 (A) First horizontal panel shows the number of COPD patients able to exercise at a specific load; from left to right the graphs present patients with normal hemodynamic response, patients with exercise-induced pulmonary hypertension, patients with pulmonary hypertension and all patients. The next panels show the development of variables during exercise for each patients, as well as the mean values represented by light blue lines for COPD-normal, red lines for COPD-EIPH, and dark blue lines for COPD-PH. With increasing load, fewer patients are represented in the presentation of the mean. (B) Development of arterial blood gases, lactate, and pH during exercise.](/cms/asset/37a90955-9ebf-4931-b0c3-e78d3518f754/dcop_a_161175_f0001_c.jpg)
![Figure 1 (A) First horizontal panel shows the number of COPD patients able to exercise at a specific load; from left to right the graphs present patients with normal hemodynamic response, patients with exercise-induced pulmonary hypertension, patients with pulmonary hypertension and all patients. The next panels show the development of variables during exercise for each patients, as well as the mean values represented by light blue lines for COPD-normal, red lines for COPD-EIPH, and dark blue lines for COPD-PH. With increasing load, fewer patients are represented in the presentation of the mean. (B) Development of arterial blood gases, lactate, and pH during exercise.](/cms/asset/77bfafc8-b7ed-492c-8525-ab75d9a4bd62/dcop_a_161175_f0001a_c.jpg)
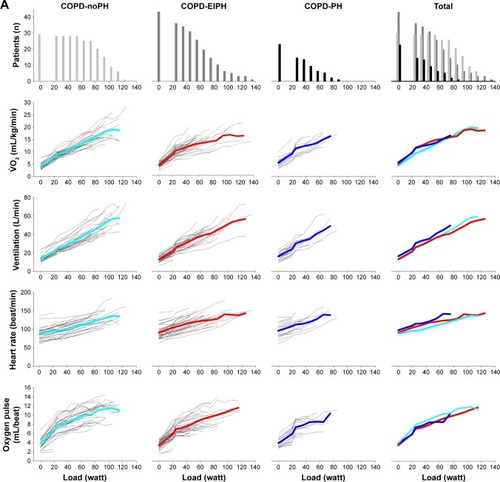
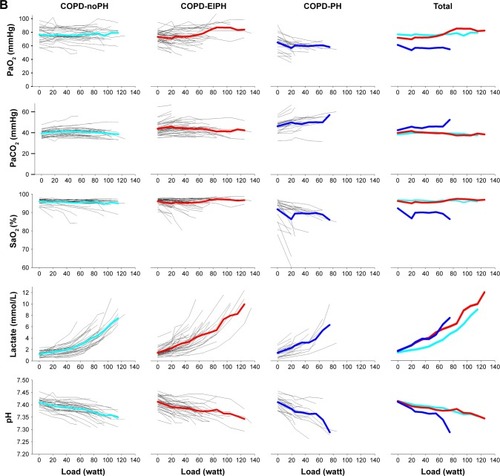
Table 4 Estimated differences between COPD patients with normal exercise responses, exercise-induced pulmonary hypertension, and pulmonary hypertension at rest in a linear mixed model that includes measurements at rest and each level of exercise, adjusted for gender, age, and FEV1