Figures & data
Table 1 Demographic and clinical characteristics of participants with COPD
Table 2 Kappa of agreement for the symptom groups by CAT and CCQ (cutpoint =1.5)
Table 3 Kappa of agreement for the symptom groups by CAT and CCQ (cutpoint =1.0)
Figure 1 Differences in classification of symptom group using CAT and CCQ.
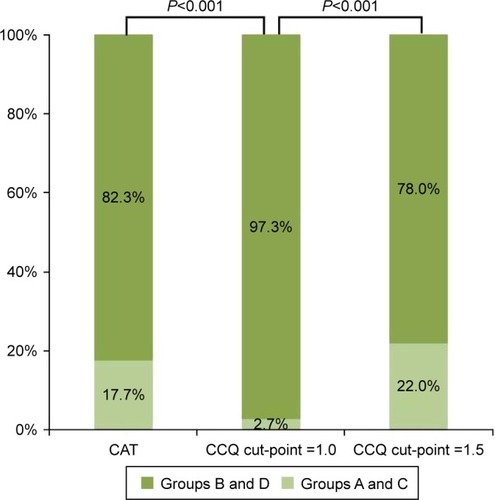
Table 4 FEV1/FVC, FEV1% predicted, exacerbation frequency and mMRC in different CAT categories
Table 5 FEV1/FVC, FEV1% predicted, exacerbation frequency, and mMRC in different CCQ categories
Table 6 Score of CAT and CCQ by GOLD grades
Table 7 Score of CAT and CCQ by exacerbation frequencies
Figure 2 Distribution of CAT impact levels into different exacerbation frequencies.
Abbreviation: CAT, COPD Assessment Test.
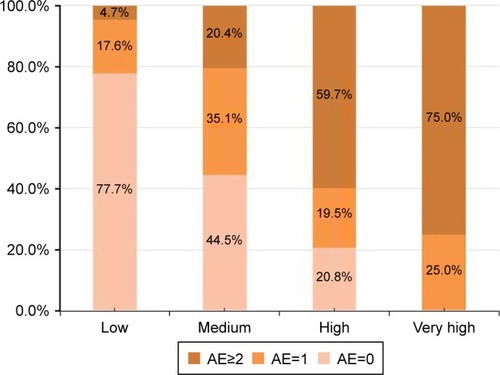
Figure 3 Distribution of CCQ categories into different exacerbation frequencies.
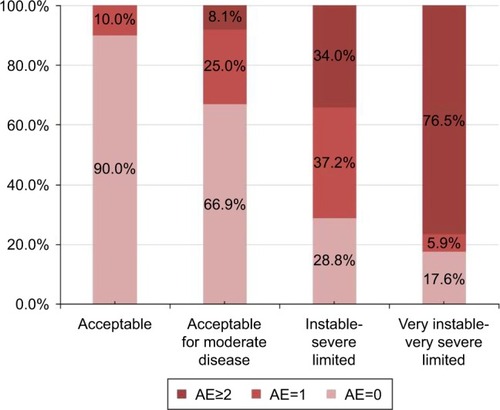
Table 8 Spearman rank correlations between health status questionnaires (CAT and CCQ), lung function, exacerbation frequency in the previous year, and mMRC dyspnea scale at baseline (n=372)
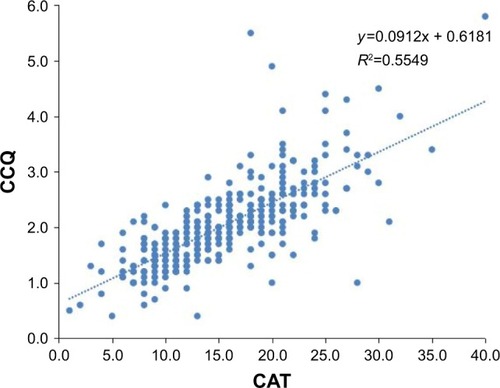
Figure 4 Spearman rank correlations between the CAT and the total CCQ score.