Figures & data
Figure 1 Cohort assembly flowchart.
Abbreviations: 6MWT, 6-minute walking test; RA, room air.
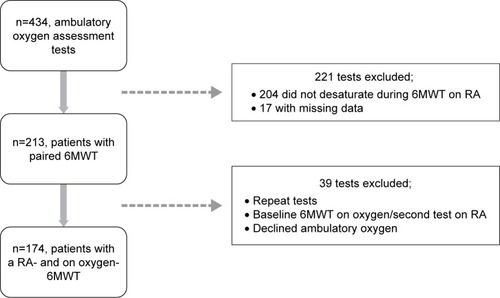
Table 1 Characteristics of the study population
Table 2 6MWT performance pre- and post-oxygen
Table 3 6MWT (on oxygen) performance in both response groups
Figure 2 Individual response patterns to ambulatory oxygen.
Abbreviations: 6MWD, 6-minute walking distance; RA, room air.
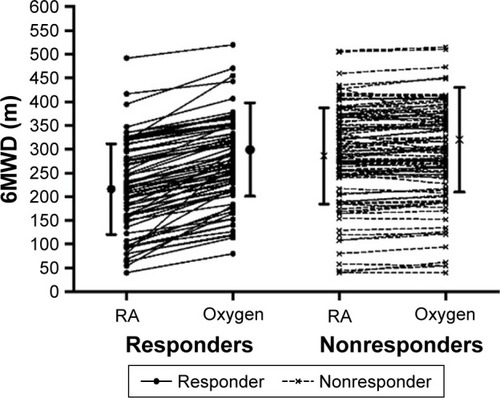
Table 4 Multivariate Cox proportional hazards model
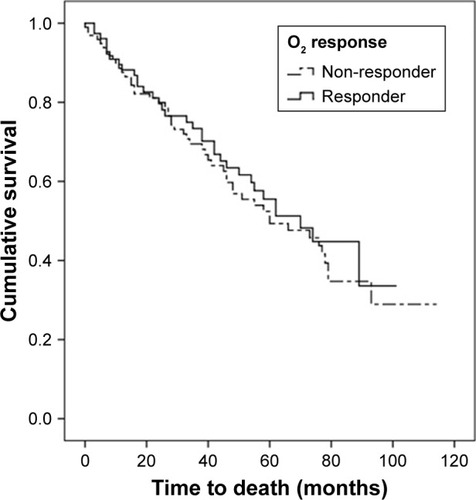
Figure 3 Kaplan–Meier survival curve.
Note: O2 responders’ and nonresponders’ survival curves show no significant survival difference (χ2=0.32, P=0.571).