Figures & data
Figure 1 Correlation between AWT-Pi10 and percentage of low attenuation volume (LAV%) in 174 patients with COPD.
Notes: ◆: Bronchodilator response using 200 μg salbutamol of FEV1 ≥200 mL and 12% from baseline values. ◇: bronchodilator response using 200 μg salbutamol of FEV1 <200 mL and 12% from baseline values. Horizontal line shows mean + 2SD of LAV% in the asymptomatic smokers. Vertical line shows mean + 2SD of AWT-Pi10 in the asymptomatic smokers.
Abbreviations: NCT, normal by computed tomography; AD, airway-dominant; ED, emphysema-dominant; FEV1, forced expiratory volume in 1 second; AWT, airway wall thickness.
Abbreviations: NCT, normal by computed tomography; AD, airway-dominant; ED, emphysema-dominant; FEV1, forced expiratory volume in 1 second; AWT, airway wall thickness.
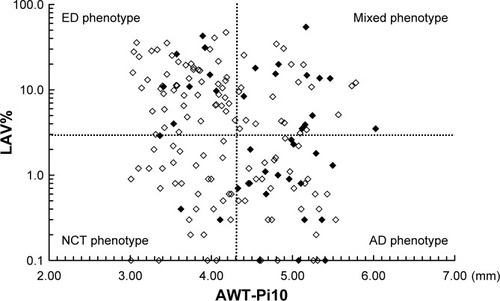
Table 1 Clinical characteristics of patients with the NCT, AD, ED, and mixed phenotypes
Figure 2 Response to short-acting β2 agonists in patients with the NCT, AD, ED, and mixed phenotypes.
Note: Values are mean ± standard error of the mean.
Abbreviations: NCT, normal by computed tomography; AD, airway-dominant; ED, emphysema-dominant; FEV1, forced expiratory volume in 1 second.
Abbreviations: NCT, normal by computed tomography; AD, airway-dominant; ED, emphysema-dominant; FEV1, forced expiratory volume in 1 second.
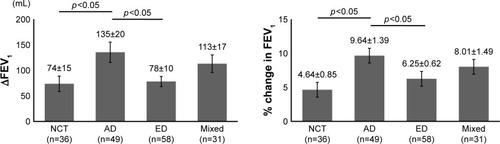
Table 2 Respiratory impedance in patients with the NCT, AD, ED, and mixed phenotypes
Table 3 Correlation between the respiratory impedance and the degree of airway wall thickness, emphysema, and reversibility of airway obstruction in patients with COPD (n=174)
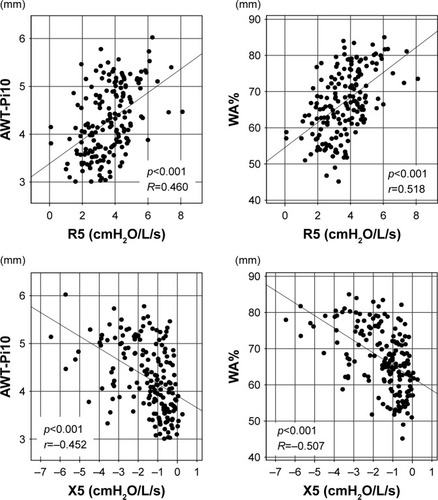
Figure 3 Correlation between respiratory impedance and the degree of airway wall thickness on chest CT in patients with COPD (n=174).
Abbreviations: WA%, percentage of wall area; CT, computed tomography; AWT, airway wall thickness.