
Figures & data
Table 1 Characteristics of COPD patients
Figure 1 Flow diagram of the study.
Abbreviations: CT, computed tomography; EI, emphysema index; HRCT, high-resolution computed tomography.
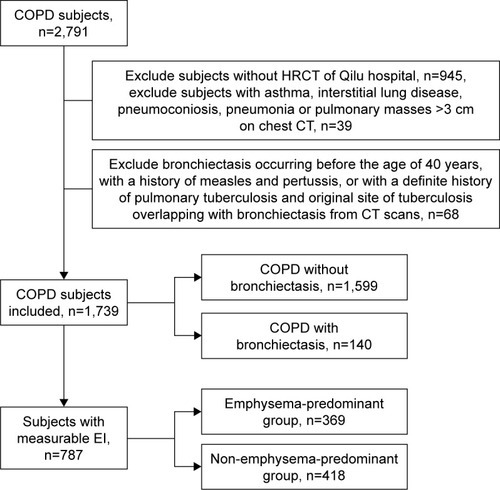
Table 2 Comparison between subjects with and without bronchiectasis
Table 3 Comparison of characteristics between emphysema-predominant group and non-emphysema-predominant group
Figure 2 Correlation between the severity of bronchiectasis and airflow limitation or emphysema.
Notes: (A) Correlation between Bhalla score and FEV1% predicted. (B) Correlation between Bhalla score and emphysema index.
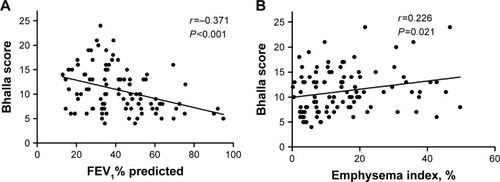
Table 4 Logistic regression analysis for predictors of bronchiectasis among COPD subjects