
Figures & data
Table 1 Demographic data
Table 2 Readmission rates between ED- and hospital-managed AECOPD
Figure 1 Kaplan–Meier curves representing days until first readmission between the ED (emergency department group) and Ho (hospitalized group). The shaded areas represent the 95% confidence intervals. Readmissions in the ED group were significant sooner than in the hospitalized group (p=0.0063).
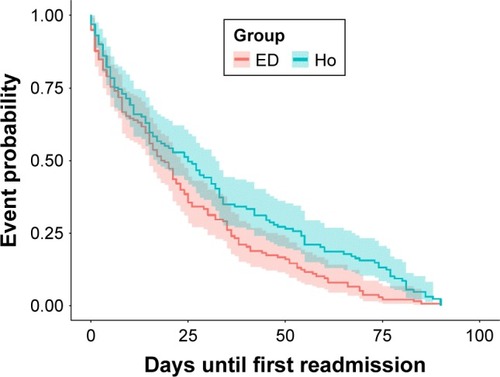
Table 3 Factors predicting all-cause readmission in the ED group
Table 4 Factors predicting COPD readmission in ED-managed patients
Table 5 ED management (investigations and treatment) of AECOPD