Figures & data
Table 1 Patient demographics and baseline clinical characteristics
Table 2 Patient-reported symptom burden and health-related quality of life (patient self-completion questionnaire assessed)
Table 3 Symptom burden and health-related quality of life by MMAS-8 (primary study population)
Table 4 Physician-reported symptom burden and health-related quality of life (patient record form assessed)
Table 5 Symptom burden of patients categorized by GOLD ABCD group
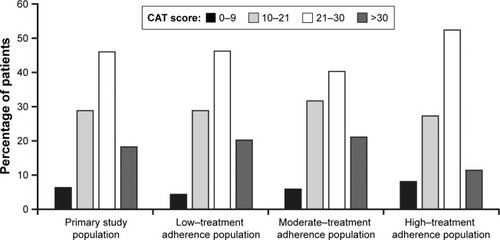
Figure 1 Percentage of patients by CAT score category for the primary study population overall and by adherence to treatment categories.a
Notes:
aAssessed using the MMAS-8: low, <6; moderate, 6–7; high, 8. Use of the ©MMAS is protected by US copyright laws. Permission for use is required. A license agreement is available from Donald E Morisky, ScD, ScM, MSPH, Professor, Department of Community Health Sciences, UCLA School of Public Health, 650 Charles E. Young Drive South, Los Angeles, CA 90095-1772.
Abbreviations: CAT, COPD Assessment Test; MMAS-8, Morisky Medication Adherence Scale 8.
Abbreviations: CAT, COPD Assessment Test; MMAS-8, Morisky Medication Adherence Scale 8.