
Figures & data
Table 1 Number of patients (%) who showed technique improvement in MDI usage, sorted by steps
Table 2 Number of patients (%) who showed technique improvement in Turbuhaler® usage, sorted by steps
Table 3 Sociodemographic and disease-related characteristics of patients participating in the study
Figure 1 Flow diagram for the time of assessing technique and dropout rates.
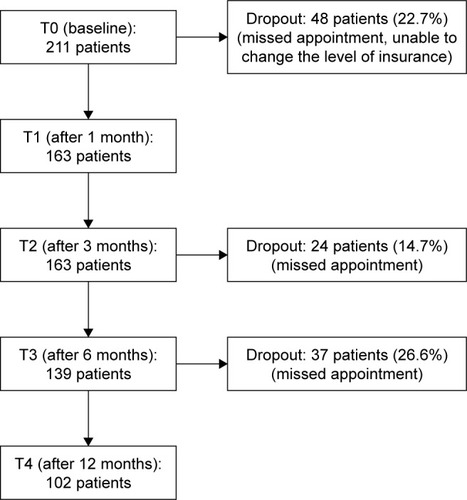
Figure 2 Comparison of the percentage of patients performing the correct inhaler technique over the study period.
Abbreviation: MDI, metered-dose inhaler.
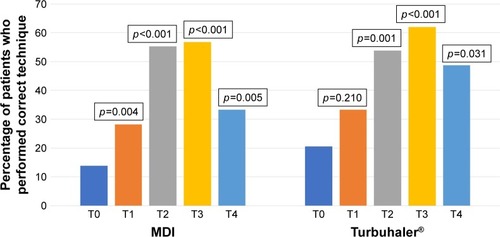
Figure 3 Comparison of the mean technique score for MDI across the study period.
Notes: T0, baseline; T1, after 1 month; T2, after 3 months; T3, after 6 months and T4, after 12 months. p: p-value of ANOVA and post hoc tests in comparison of the score between after the training (T1, T2, T3, T4) and before training (T0).
Abbreviations: ANOVA, analysis of variance; MDI, metered-dose inhaler; SD, standard deviation.
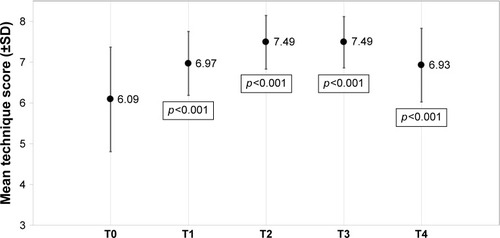
Figure 4 Comparison of the mean technique score for Turbuhaler® across the study period.
Abbreviations: ANOVA, analysis of variance; SD, standard deviation.
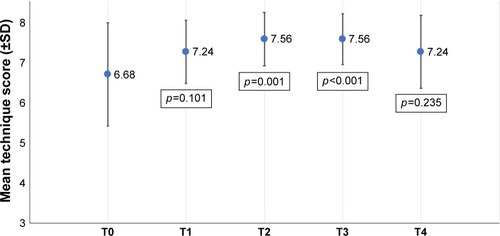
Table 4 Patients’ age and improvement in technique score with MDI
Table 5 Years of suffering from COPD and improvement in technique score with MDI
Table 6 Years of attending the program and improvement in technique score with MDI