Figures & data
Table 1 Primer sequences of candidate genes
Table 2 Baseline characteristics of the COPD group and control group
Figure 1 Relative mRNA levels of NF-κB family genes in COPD group and control group. Relative mRNA levels of NF-κB family genes were expressed as the mean value ± standard deviation. *P < 0.05, compared with the control group.
Abbreviations: NF-κB, nuclear factor-κB; COPD, chronic obstructive pulmonary disease.
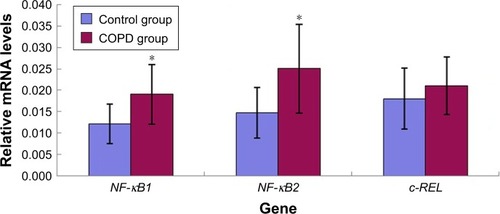
Figure 2 Relative mRNA levels of NF-κB family genes among patients with different severities of COPD. Relative mRNA levels of NF-κB family genes were expressed as the mean value ± standard deviation.
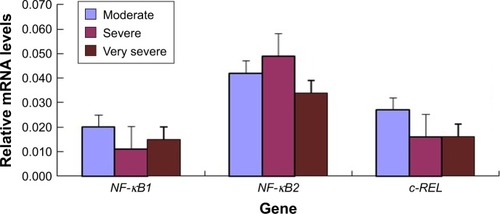
Table 3 Differences in inflammatory molecules levels between COPD group and control group (mean ± standard deviation)
Table 4 Differences in inflammatory molecules levels between smokers and nonsmokers with or without COPD
Table 5 Differences in inflammatory molecules levels among patients with different severities of COPD
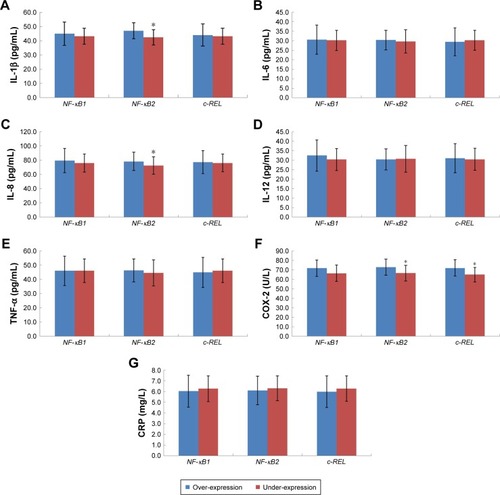
Figure 3 Subgroup analysis of inflammatory molecules levels based on the mRNA expression levels of NF-κB family genes in patients with COPD: (A) IL-1β, (B) IL-6, (C) IL-8, (D) IL-12, (E) TNF-α, (F) COX-2 and (G) CRP. *P < 0.05, compared with over-expression subgroup.