Figures & data
Table 1 Characteristics of the studied population
Figure 1 Biomarkers concentration in the biological fluids from populations investigated: (A) IL-26 in induced sputum; (B) CRP level in serum; (C) leptin level in serum.
Abbreviations: CRP, C-reactive protein; IL, interleukin.
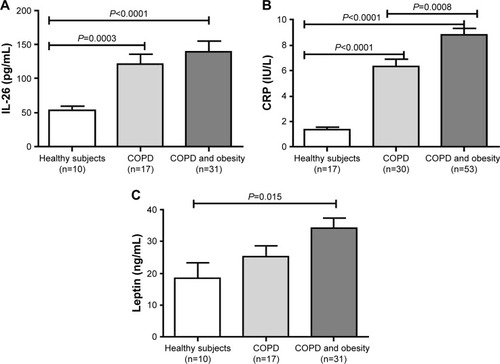
Figure 2 Correlation analysis (A) IL-26 with BMI; (B) CRP with BMI; (C) leptin with BMI; (D) IL-26 with CRP; (E) IL-26 with leptin; (F) leptin with CRP.
Abbreviations: BMI, body mass index; CRP, C-reactive protein; IL, interleukin.
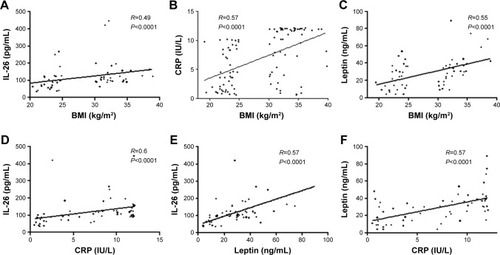
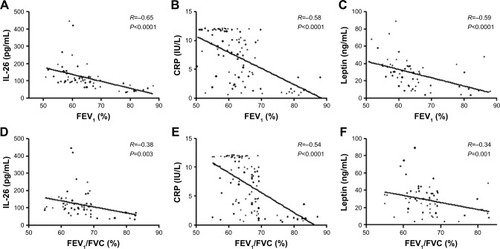
Figure 3 Correlation analysis (A) IL-26 with FEV1; (B) CRP with FEV1; (C) leptin with FEV1; (D) IL-26 with FEV1/FEV; (E) CRP with FEV1/FVC; (F) leptin with FEV1/FEV.
Abbreviations: CRP, C-reactive protein; FEV1, forced expiratory volume in 1 second; FVC, forced vital capacity; IL, interleukin.