Figures & data
Table 1 Baseline characteristics of participants
Figure 1 Study flow diagram.
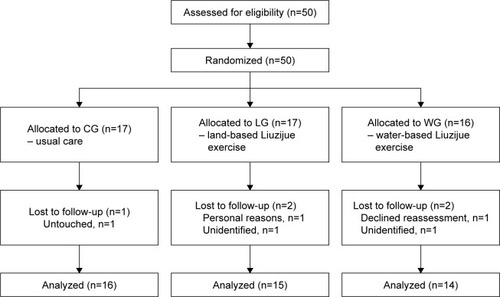
Table 2 Comparisons of group changes (%) in pulmonary function and respiratory muscle strength
Figure 2 Pulmonary function before and after the 3-month intervention.
Notes: Data are expressed as mean ± SD. No differences were observed between the groups at baseline and after the intervention. Within-groups comparison was made by the paired-sample t-test.
Abbreviations: %pred, percentage of predicted values; CG, control group; FEV1, forced expiratory volume in the first second; FVC, forced vital capacity; LG, land-based Liuzijue exercise group; post, postintervention; pre, preintervention; WG, water-based Liuzijue exercise group.
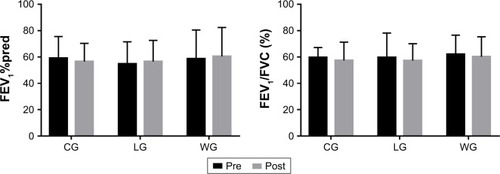
Figure 3 Changes of pulmonary function and respiratory muscle strength after the 3-month intervention.
Notes: Delta changes (%) = ([post − pre]/pre) ×100, and they are expressed as mean ± SEM. Between-group comparisons used the one-way analysis of variance or the nonparametric Kruskal–Wallis test and are expressed as a p-value. The level of significance was set at p<0.05, and ##p<0.01 means it was significant when compared to the control group.
Abbreviations: %pred, percentage of predicted values; CG, control group; FEV1, forced expiratory volume in the first second; FVC, forced vital capacity; LG, land-based Liuzijue exercise group; PEmax, maximal expiratory pressure; PImax, maximal inspiratory pressure; WG, water-based Liuzijue exercise group.
![Figure 3 Changes of pulmonary function and respiratory muscle strength after the 3-month intervention.Notes: Delta changes (%) = ([post − pre]/pre) ×100, and they are expressed as mean ± SEM. Between-group comparisons used the one-way analysis of variance or the nonparametric Kruskal–Wallis test and are expressed as a p-value. The level of significance was set at p<0.05, and ##p<0.01 means it was significant when compared to the control group.Abbreviations: %pred, percentage of predicted values; CG, control group; FEV1, forced expiratory volume in the first second; FVC, forced vital capacity; LG, land-based Liuzijue exercise group; PEmax, maximal expiratory pressure; PImax, maximal inspiratory pressure; WG, water-based Liuzijue exercise group.](/cms/asset/f7b45836-74ee-47ec-8178-8e496ceceed4/dcop_a_165593_f0003_b.jpg)
Figure 4 Respiratory muscle strength before and after the 3-month intervention.
*p<0.05, comparisons were significant within groups. **p<0.01, comparisons were significant within groups.
Abbreviations: CG, control group; LG, land-based Liuzijue exercise group; PEmax, maximal expiratory pressure; PImax, maximal inspiratory pressure; post, postintervention; pre, preintervention; WG, water-based Liuzijue exercise group.
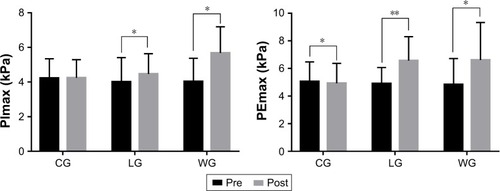
Table 3 Comparisons of group changes (%) in muscle function of elbow joints
Figure 5 Muscle function of elbow joints before and after the 3-month intervention.
Abbreviations: BW, body weight; CG, control group; ER, endurance ratio; LG, land-based Liuzijue exercise group; post, postintervention; pre, preintervention; PT, peak torque; TW, total work; WG, water-based Liuzijue exercise group.
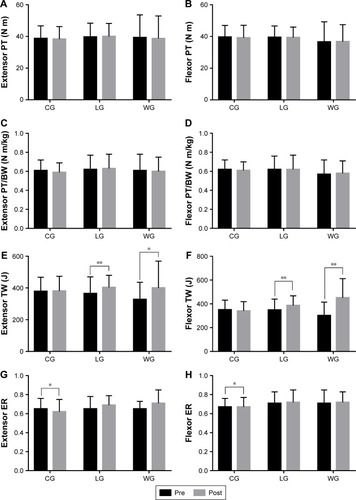
Table 4 Comparisons of group changes (%) in muscle function of knee joints
Figure 6 Muscle function of knee joints before and after the 3-month intervention.
Notes: (A–D) Within-groups comparisons in CG, LG, and WG of the knee extensor and flexor PT and PT/BW to reflect the changes of muscle strength after intervention; (E–H) Within-groups comparisons in CG, LG, and WG of the knee extensor and flexor TW and ER to reflect the changes of muscle endurance after intervention. Data are expressed as mean ± SD. No differences were observed between the groups at baseline. Within-groups comparisons were made with the paired-sample t-test. *p<0.05, comparisons were significant within groups. **p<0.01, comparisons were significant within groups.
Abbreviations: BW, body weight; CG, control group; ER, endurance ratio; LG, land-based Liuzijue exercise group; post, postintervention; pre, preintervention; PT, peak torque; TW, total work; WG, water-based Liuzijue exercise group.
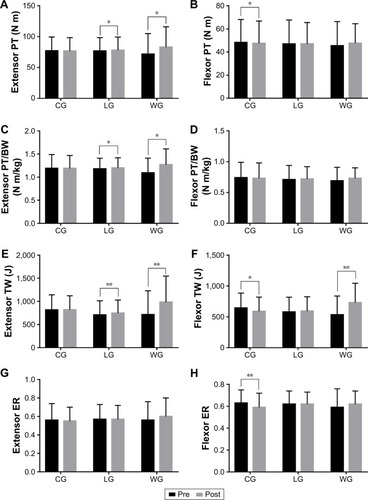
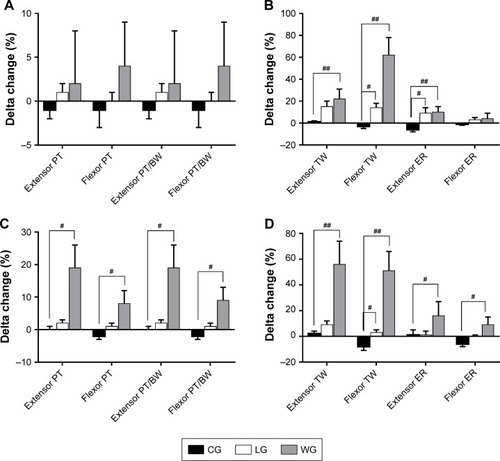
Figure 7 Changes of elbow and knee joints of muscle function after 3-month intervention. Muscle function of elbow joints are shown in A and B, while knee joints are shown in C and D.
Abbreviations: BW, body weight; CG, control group; ER, endurance ratio; LG, land-based Liuzijue exercise group; post, postintervention; pre, preintervention; PT, peak torque; TW, total work; WG, water-based Liuzijue exercise group.