Figures & data
Figure 1 Flow diagram of literature search and study selection.
Abbreviation: COPD, chronic obstructive pulmonary disease.
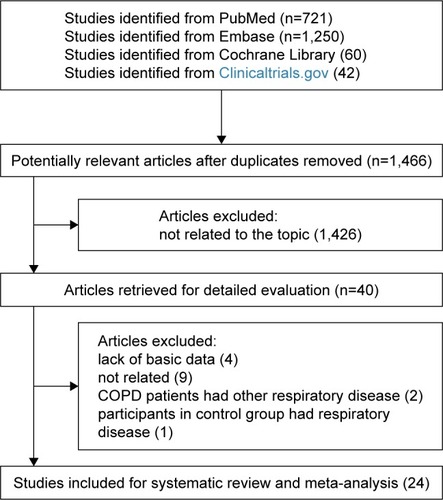
Table 1 Characters of included studies
Table 2 Subgroup analyses
Figure 2 Comparison of FENO levels between COPD patients and controls in the included studies.
Abbreviations: CI, confidence interval; COPD, chronic obstructive pulmonary disease; FENO, fractional exhaled nitric oxide; IV, inverse variance; SMD, standard mean deviation; SD, standard deviation.
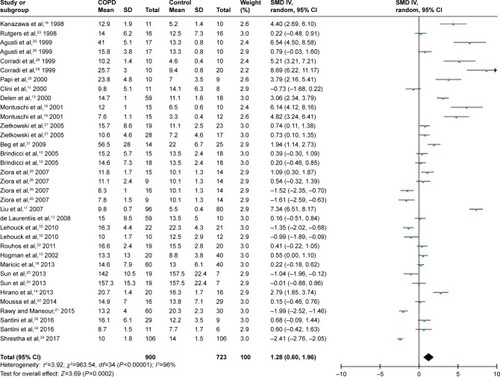
Figure 3 Comparison of fractional exhaled nitric oxide levels between stable/exacerbated COPD patients and controls.
Abbreviations: CI, confidence interval; COPD, chronic obstructive pulmonary disease; FENO, fractional exhaled nitric oxide; IV, inverse variance; SMD, standard mean deviation; SD, standard deviation.
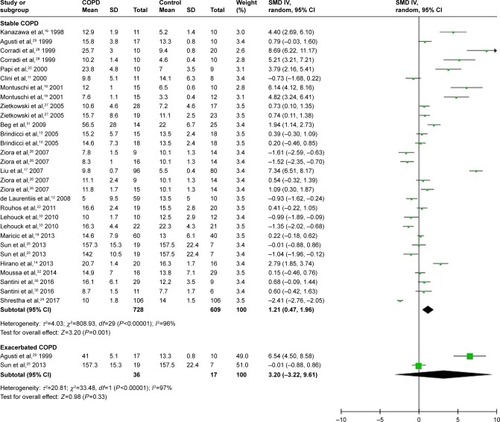
Figure 4 Comparison of FENO levels between ex-smokers and current smokers.
Abbreviations: CI, confidence interval; FENO, fractional exhaled nitric oxide; IV, inverse variance; SMD, standard mean deviation; SD, standard deviation.
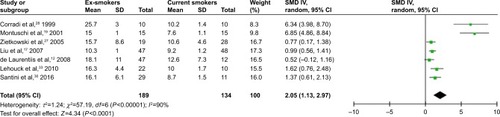
Figure S1 Sensitivity analysis of included studies by omitting each study.
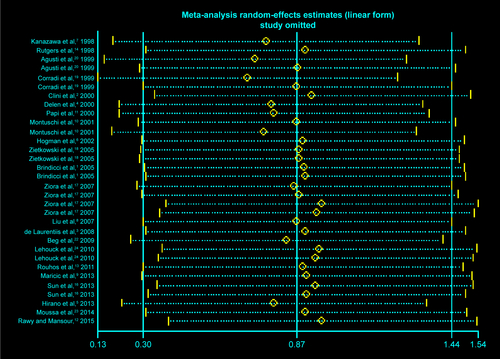
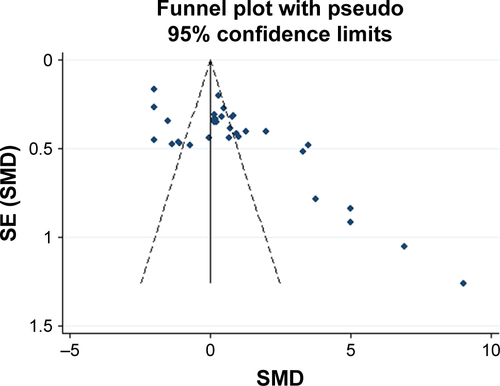
Figure S2 Funnel plot of exhaled nitric oxide in COPD.
Abbreviations: SE, standard error; SMD, standard mean difference.