Figures & data
Table 1 Baseline characteristics
Table 2 CAT, SNOT 22, mMRC score, and spirometric variables at baseline and at the end of the study
Figure 1 Graphs represent differences, controlled by score at enrollment, in CAT, SNOT 22, and mMRC questionnaires among subgroups according to allergy, history of exacerbations, smoking status, spirometry stage, GOLD stage, and ICS therapy.
Abbreviations: CAT, COPD assessment test; GOLD, Global initiative for chronic Obstructive Lung Disease; ICS, inhaled corticosteroid; mMRC, modified Medical Research Council; SNOT 22, Sinonasal Outcome Test.
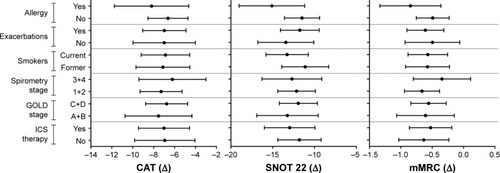
Table 3 Percentage of score ≥1 and ≥4 for each item of CAT
Table 4 Percentage of score ≥1 and ≥4 for each item of SNOT 22 nose, ear, and facial subdomains
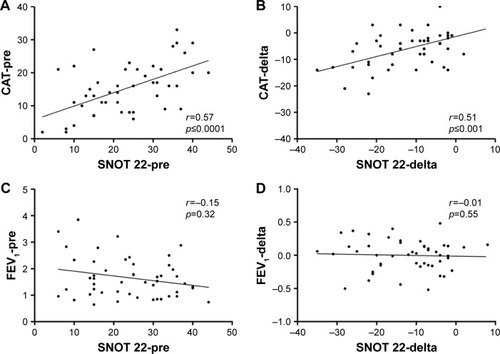
Figure 2 Scatter plots representing FEV1 values, CAT, and SNOT 22 questionnaire scores at enrollment (visit 0) and after therapy (delta, difference between visit 2 and visit 0). Spearman’s rank correlation test was used to determine the relationships between axis.
Abbreviations: CAT, COPD assessment test; FEV1, forced expiratory volume in 1 second; SNOT 22, Sinonasal Outcome Test.