
Figures & data
Table 1 Baseline patient characteristics (n=112)
Figure 1 Scatter plot showing relationships between CT-emphysema index/FEV1 COPD phenotypes and GOLD groups among patients (n=112).
Note: Right upper quadrant = emphysema-dominant; right lower quadrant = mild mixed airway-emphysema disease; left lower quadrant = airway-dominant; left upper quadrant = severe mixed airway-emphysema.
Abbreviations: BD, bronchodilator; CT, computed tomography; FEV1, forced expiratory volume in 1 second; GOLD, Global Initiative for Chronic Obstructive Lung Disease.
Abbreviations: BD, bronchodilator; CT, computed tomography; FEV1, forced expiratory volume in 1 second; GOLD, Global Initiative for Chronic Obstructive Lung Disease.
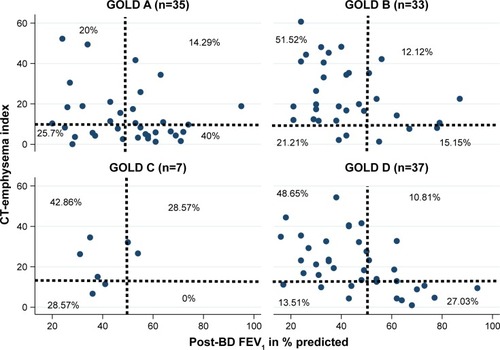
Figure 2 Kaplan–Meier survival probability estimates according to CT-emphysema index/FEV1 COPD phenotypes.
Abbreviations: CT, computed tomography; FEV1, forced expiratory volume in 1 second.
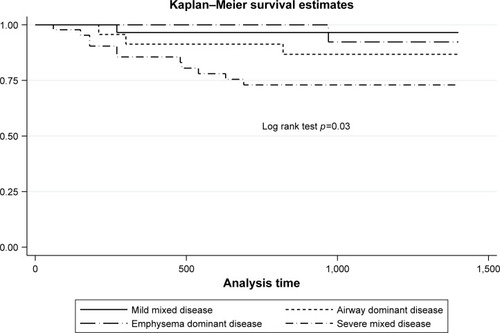
Figure 3 Kaplan–Meier survival probability estimates according to GOLD 2017 groups. Abbreviation: GOLD, Global Initiative for Chronic Obstructive Lung Disease.
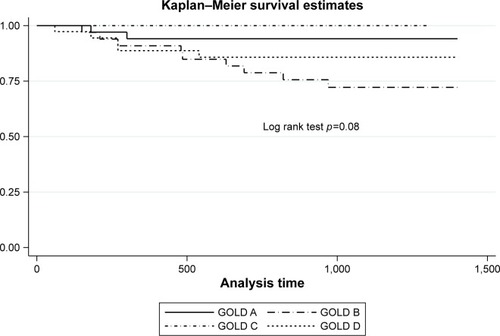
Table 2 Predictors in Cox proportional hazard models of COPD-associated mortality