
Figures & data
Table 1 Study population providing bronchial and lung samples for immunohistochemical study
Figure 1 Expression of RNA-binding proteins in human bronchial rings.
Notes: (A) Photomicrographs showing immunostaining for HuR, TTP, and AUF-1 in bronchial epithelium, mucous gland cells, and serous gland cells (left to right) from a CS with NLF and a patient with mild-to-moderate COPD (C) (representative of n=12 for each group, see the “Methods” section). Scale bar set at 20 µm. (B) Individual and median (line) cell counts of nuclear immunostaining for HuR, TTP, and AUF-1 in bronchial epithelial cells, mucous gland cells, and serous gland cells (left to right) of CS and COPD, normalized as indicated. Student’s t-test P-value for COPD vs CS is indicated in all panels. *P<0.05 vs CS. Scale bar set at 20 µm, magnification 1,000×.
Abbreviations: C, patients with COPD; HuR, human antigen R; TTP, tristetraprolin; AUF-1, AU-rich element-binding factor 1; NLF, normal lung function; CS, control smoker.
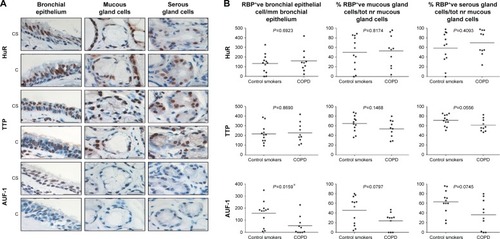
Figure 2 Expression of RNA-binding proteins in human peripheral lung.
Abbreviations: C, patients with COPD; HuR, human antigen R; TTP, tristetraprolin; AUF-1, AU-rich element-binding factor 1; CS, control smoker.
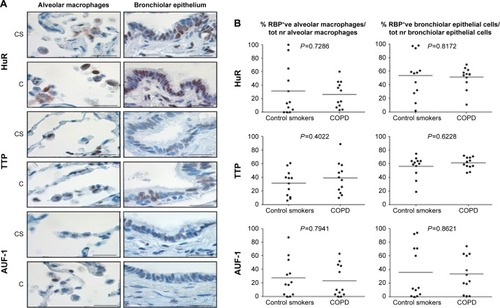
Figure 3 Modulation of the expression of RNA-binding proteins in the human bronchial epithelial cell line BEAS-2B.
Abbreviations: HuR, human antigen R; TTP, tristetraprolin; AUF-1, AU-rich element-binding factor 1; RBP, RNA-binding protein; SEM, standard error of mean.
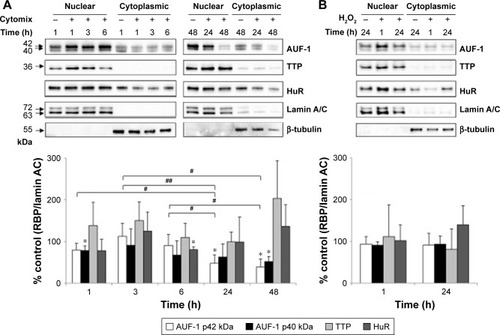
Figure 4 Effect of CSE on RBP expression in BEAS-2B cells.
Abbreviations: CSE, cigarette smoke extract; HuR, human antigen R; TTP, tristetraprolin; AUF-1, AU-rich element-binding factor 1; ND, not determined; RBP, RNA-binding protein; SEM, standard error of mean.
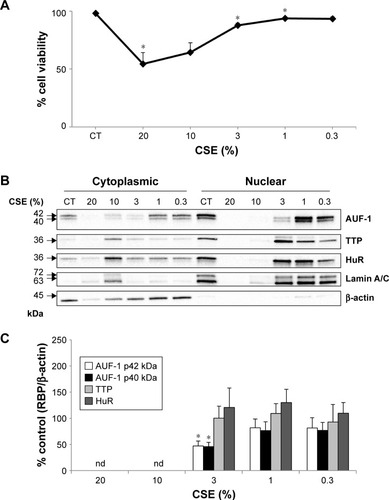
Figure 5 Expression of RNA-binding proteins in BEAS-2B cells following AUF-1 silencing.
Abbreviations: HuR, human antigen R; TTP, tristetraprolin; AUF-1, AU-rich element-binding factor 1; SEM, standard error of mean.
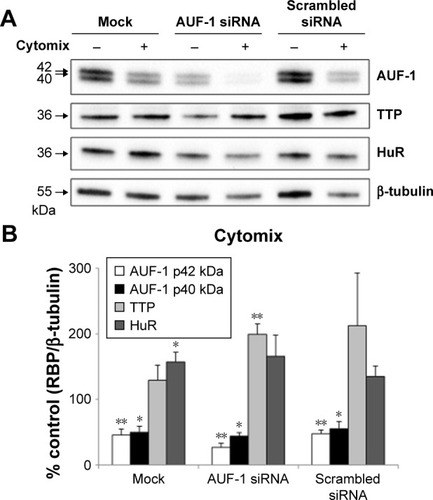
Figure 6 Expression of AUF-1-targeted cytokines in BEAS-2B cells following AUF-1 silencing.
Abbreviations: AUF-1, AU-rich element-binding factor 1; IL-6, interleukin 6.
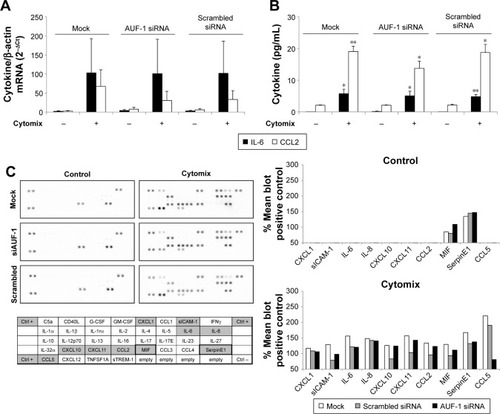
Figure 7 Differential expression of RNA-binding proteins in transcriptomic analysis of primary human airway epithelial cells.
Notes: Expression of AUF-1, TTP, and HuR (corresponding gene names indicated in legend) was investigated in the GEO database GSE5058.Citation36 (A) Clinical characteristics of study population where epithelial cells were collected by bronchial brushing. Reprinted from, Cancer Research, 2018; 66(22):10729–10740, Carolan BJ et al, Up-regulation of Expression of the Ubiquitin Carboxyl-Terminal Hydrolase L1 Gene in Human Airway Epithelium of Cigarette Smokers, with permission from AACR.Citation36 (B) Scatterplot showing FC for RBP expression between smokers vs nonsmoker controls, COPD vs nonsmokers, and COPD vs smoker controls (left to right). FCs for RBPs were set at ≥2.0 with a false discovery rate of #0.05.
Abbreviations: HuR, human antigen R; TTP, tristetraprolin; AUF-1, AU-rich element-binding factor 1; FC, fold change; RBP, RNA-binding protein.
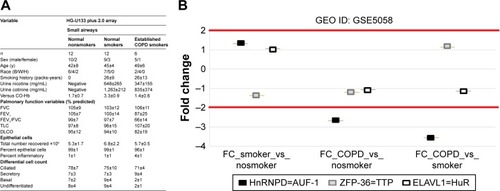
Figure 8 Expression of AUF-1-dependent genes in airway epithelial gene array database GSE5058.
Abbreviations: AUF-1, AU-rich element-binding factor 1; FC, fold change.
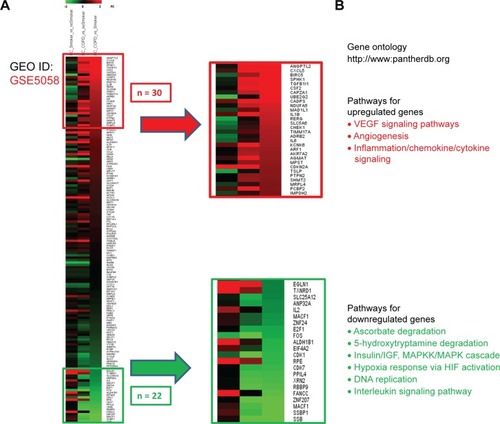
Figure S1 Expression of RBP mRNA in PBMC of COPD patients and control smokers.
Notes: Real-time PCR analysis for RBP mRNA in PBMC of control smokers (n=4) and COPD patients (n=5) (Table S1). Data are mean ± SEM of RBP mRNA normalized to GAPDH mRNA and expressed as fold over GAPDH (ctrl) (as 2−ΔCt).
Abbreviations: RBP, RNA-binding protein; PBMC, peripheral blood mononuclear cell; SEM, standard error of mean.
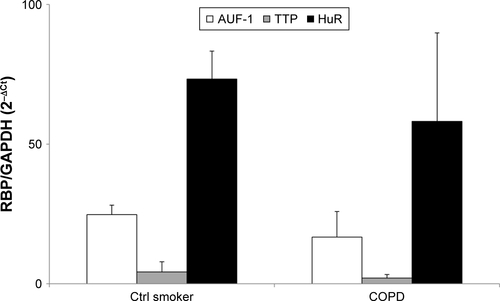
Figure S2 Evaluation of treatment-induced apoptosis in BEAS-2B cells.
Notes: Western blot analysis of PARP and cleaved Caspase 3 expression in nuclear and cytoplasmic lysates obtained from BEAS-2B cells exposed to cytomix (left panel) and 200 µM (right panel) for the indicated times. Only the full-length bands of PARP and Caspase 3 were detectable in experimental samples, excluding treatment-induced apoptosis. Positive control (C+) is whole cell lysate of gefitinib-treated H1975 NSCLC cell line. Representative immunoblots of n=3 independent experiments are shown. Lamin A/C and tubulin are shown as nuclear and cytoplasmic loading controls, respectively.
Abbreviation: NSCLC, non-small-cell lung cancer.
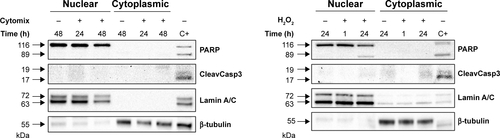
Figure S3 Expression of RBP mRNA in BEAS-2B cells.
Notes: Real-time PCR analysis for RBP mRNA in nontransfected BEAS-2B cells stimulated with (A) cytomix and (B) hydrogen peroxide (200 M for the indicated times (mean ± SEM of n=3). (C) RBP mRNA in BEAS-2B cells stimulated 48 hours with cytomix following transfection with mock (F = Fugene), siRNA for AUF-1, scrambled siRNA (mean ± SEM of n=4). RBP mRNA was normalized to housekeeping mRNA levels and expressed as fold over corresponding unstimulated controls (2−ΔCt). *P<0.05 versus controls.
Abbreviations: AUF-1, AU-rich element-binding factor 1; RBP, RNA-binding protein; SEM, standard error of mean.
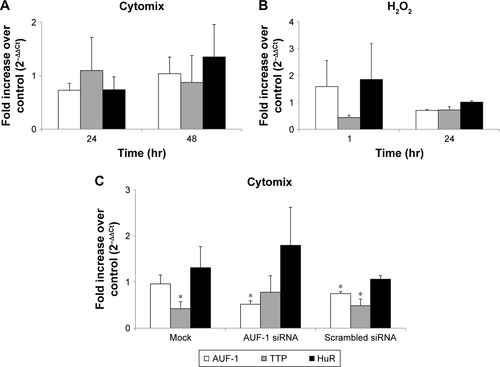
Figure S4 Evaluation of treatment-induced apoptosis in BEAS-2B cells following AUF-1 silencing.
Notes: Western blot analysis of PARP expression in whole cell lysates obtained from BEAS-2B cells untreated and stimulated 48 hours with cytomix following transfection with AUF-1 siRNA, scrambled siRNA, and mock transfection (Fugene) (mean ± SEM of n=4). Positive control (Ctrl) showing cleaved PARP protein band is whole cell lysate of gefitinib-treated H1975 NSCLC cell line. Representative immunoblots of n=3 independent experiments are shown. β-Tubulin is shown as loading control.
Abbreviations: AUF-1, AU-rich element-binding factor 1; NLF, normal lung function; SEM, standard error of mean; NSCLC, non-small-cell lung cancer.
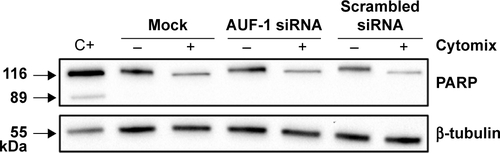
Table S1 Study population providing peripheral blood mononuclear cells (PBMC)