
Figures & data
Figure 1 Study design.
Abbreviations: PFT, pulmonary function test; Rx, treatment.
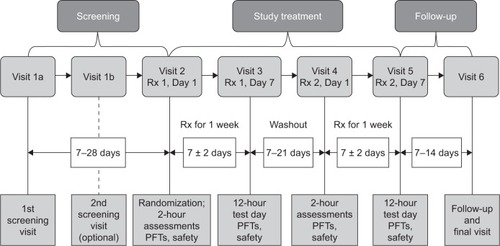
Figure 2 Patient disposition.
Note: Data presented as n (%).
Abbreviations: FEV1, forced expiratory volume in 1 second; FF, formoterol fumarate; GFF, glycopyrrolate/formoterol fumarate; GP, glycopyrrolate; MDI, metered dose inhaler.
Abbreviations: FEV1, forced expiratory volume in 1 second; FF, formoterol fumarate; GFF, glycopyrrolate/formoterol fumarate; GP, glycopyrrolate; MDI, metered dose inhaler.
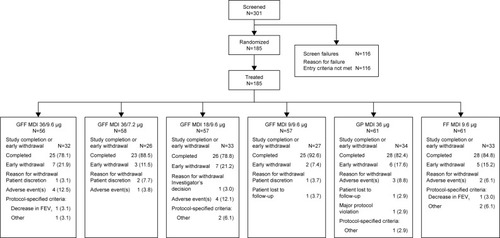
Table 1 Baseline demographics and clinical characteristics (safety population)
Figure 3 (A) FEV1 AUC0–12 on Day 7a,b (B) Change from baseline in FEV1 over time on Day 7c (mITT population).
Notes: *.<0.05, **.<0.01, ***.<0.001, #P<0.0001. aPairwise treatment comparisons. bThe geometric means are plotted, which are the exponentiated values of the LSMs for FEV1 AUC0–12 on the log scale. Error bars represent 95% CIs. The GMRs reported below the graph are shown for the comparisons with GP MDI 36 µg and FF MDI 9.6 µg. cError bars represent SE.
Abbreviations: AUC0–12, area under the curve from 0 to 12 hours; CI, confidence interval; FEV1, forced expiratory volume in 1 second; FF, formoterol fumarate; GFF, glycopyrrolate/formoterol fumarate; GMR, geometric mean ratio; GP, glycopyrrolate; LSM, least squares mean; MDI, metered dose inhaler; mITT, modified intent-to-treat; N/A, not applicable; SE, standard error.
Abbreviations: AUC0–12, area under the curve from 0 to 12 hours; CI, confidence interval; FEV1, forced expiratory volume in 1 second; FF, formoterol fumarate; GFF, glycopyrrolate/formoterol fumarate; GMR, geometric mean ratio; GP, glycopyrrolate; LSM, least squares mean; MDI, metered dose inhaler; mITT, modified intent-to-treat; N/A, not applicable; SE, standard error.
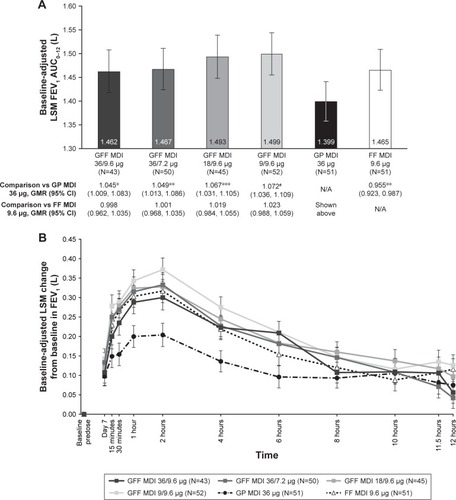
Table 2 Summary of secondary efficacy endpoints on Day 1 (mITT population)
Figure 4 (A) Peak change from baseline in FEV1 through 2 hours on Day 1a,b (B) Peak change from baseline in IC on Day 1a,b (mITT population).
Notes: *.<0.05, **.<0.01, ***.<0.001. aPairwise treatment comparisons. bError bars represent 95% CIs. Data shown below the graph are treatment differences for the comparisons with GP MDI 36 µg and FF MDI 9.6 µg.
Abbreviations: CI, confidence interval; FEV1, forced expiratory volume in 1 second; FF, formoterol fumarate; GFF, glycopyrrolate/formoterol fumarate; GP, glycopyrrolate; IC, inspiratory capacity; LSM, least squares mean; MDI, metered dose inhaler; mITT, modified intent-to-treat; N/A, not applicable.
Abbreviations: CI, confidence interval; FEV1, forced expiratory volume in 1 second; FF, formoterol fumarate; GFF, glycopyrrolate/formoterol fumarate; GP, glycopyrrolate; IC, inspiratory capacity; LSM, least squares mean; MDI, metered dose inhaler; mITT, modified intent-to-treat; N/A, not applicable.
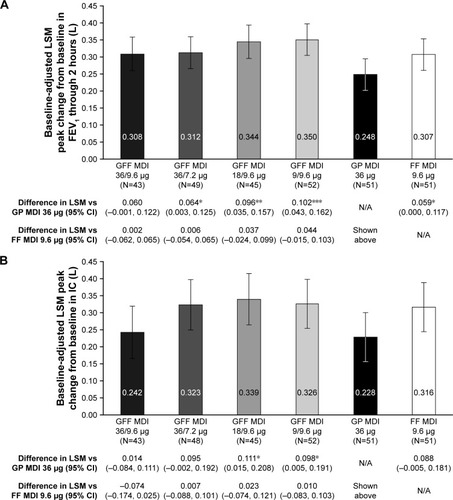
Table 3 Summary of secondary efficacy endpoints on Day 7 (mITT population)
Figure 5 (A) Peak change from baseline in FEV1 through 6 hours on Day 7a,b (B) Peak change from baseline in IC on Day 7a,b (mITT population).
Notes: *.<0.05, **.<0.01, #P<0.0001. aPairwise treatment comparisons. bError bars represent 95% CIs. Data shown below the graph are treatment differences for the comparisons with GP MDI 36 µg and FF MDI 9.6 µg.
Abbreviations: CI, confidence interval; FEV1, forced expiratory volume in 1 second; FF, formoterol fumarate; GFF, glycopyrrolate/formoterol fumarate; GP, glycopyrrolate; IC, inspiratory capacity; LSM, least squares mean; MDI, metered dose inhaler; mITT, modified intent-to-treat; N/A, not applicable.
Abbreviations: CI, confidence interval; FEV1, forced expiratory volume in 1 second; FF, formoterol fumarate; GFF, glycopyrrolate/formoterol fumarate; GP, glycopyrrolate; IC, inspiratory capacity; LSM, least squares mean; MDI, metered dose inhaler; mITT, modified intent-to-treat; N/A, not applicable.
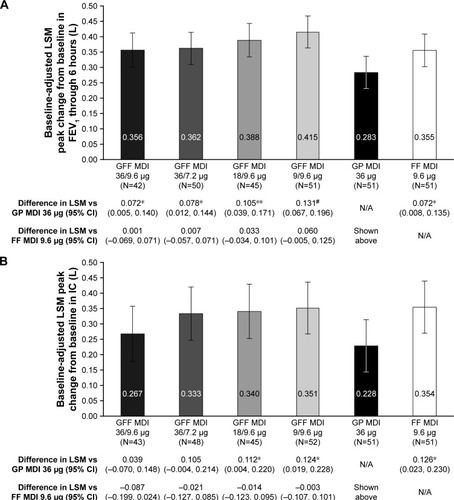
Table 4 Summary of AEs (safety population)