
Figures & data
Table 1 Characteristics of COPD patients at the end of winter and end of summer
Figure 1 Mean (SE bars) 25(OH)D concentration for housebound (n=16) and nonhousebound (n=35) COPD patients at the end of winter and at the end of summer. Notes: Differences in 25(OH)D concentration between housebound and nonhousebound patients, within each season tested using independent samples t-test and differences in 25(OH)D concentration for each group between each season tested using paired samples t-test (conducted on log transformed data. Dashed lines represent the level of vitamin D sufficiency (25(OH)D ≥50 nmol/L) and deficiency (25(OH)D ⩽25 nmol/L). *P⩽0.05, **P⩽0.001.
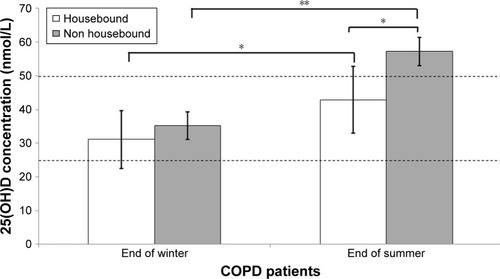
Table 2 Correlation analysis between serum 25(OH)D concentration and muscle outcomes, quality of life and CRP concentration of COPD patients at the end of winter and end of summer
Table 3 Stepwise linear regression models to investigate 25(OH)D concentration as a predictor of FFM, muscle strength and quality of life in COPD patients at the end of winter and at the end of summer
Table 4 Muscle function outcomes according to vitamin D insufficiency (25(OH)D ⩽50 nmol/L) and sufficiency (≥50 nmol/L) in COPD patients at the end of winter and at the end of summer