Figures & data
Table 1 Clinical data of included patients (75 cases)
Table 2 Correlations between clinical features and the serum levels of IL-17, IL-10, and IL-35 in patients with stable COPD (N=75)
Figure 1 Correlation between clinical factors and the serum level of IL-17 in patients with stable COPD.
Abbreviations: COPD, chronic obstructive pulmonary disease; GOLD, Global initiative for chronic obstructive Lung Disease; IL, interleukin; mMRC, modified British Medical Research Council.
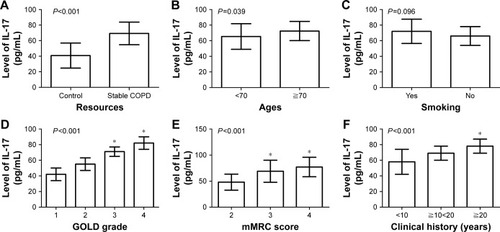
Figure 2 Correlation between clinical factors and the serum level of IL-10 in patients with stable COPD.
Abbreviations: COPD, chronic obstructive pulmonary disease; GOLD, Global initiative for chronic Obstructive Lung Disease; IL, interleukin; mMRC, modified British Medical Research Council.
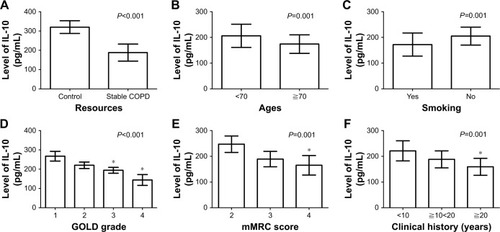
Figure 3 Correlation between clinical factors and the serum level of IL-35 in patients with stable COPD.
Abbreviations: COPD, chronic obstructive pulmonary disease; GOLD, Global initiative for chronic Obstructive Lung Disease; IL, interleukin; mMRC, modified British Medical Research Council.
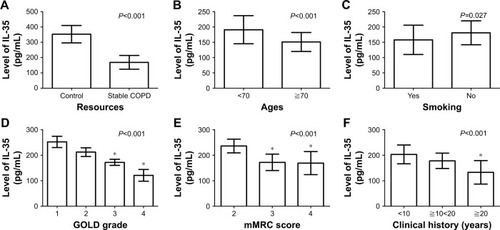
Table 3 Linear correlation analysis of important indicators (N=75)
Figure 4 Correlation between the serum levels of IL-17, IL-10, and IL-35 in patients with stable COPD.
Abbreviations: COPD, chronic obstructive pulmonary disease; IL, interleukin.
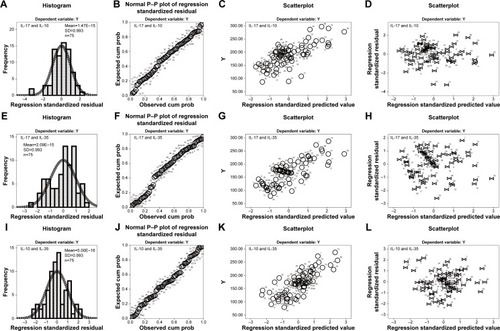
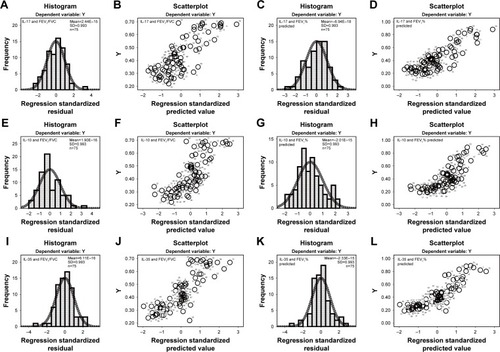
Figure 5 Correlation between the serum levels of IL-17, IL-10, and IL-35 and pulmonary function in patients with stable COPD.
Abbreviations: COPD, chronic obstructive pulmonary disease; FEV1, forced expiratory volume in 1 second; FVC, forced vital capacity; IL, interleukin.