
Figures & data
Figure 1 Study flowchart.
Abbreviations: COPD, chronic obstructive pulmonary disease; GOLD, Global Initiative for Chronic Obstructive Lung Disease.
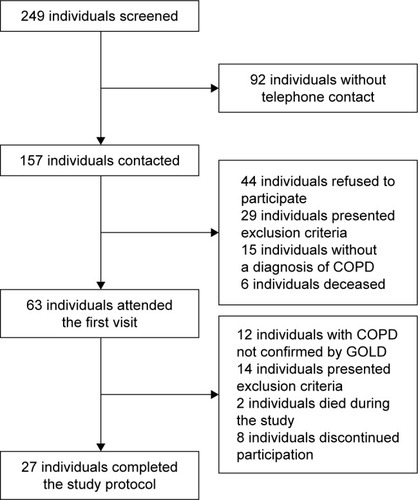
Table 1 COPD patients’ anthropometric and clinical characteristics
Table 2 Variables obtained in the CPET in COPD patients
Figure 2 Significant correlations between (A) CATs and VO2peak and (B) FEV1 (% pred.) and VO2peak in COPD patients.
Abbreviations: CATs, COPD Assessment Test score; COPD, chronic obstructive pulmonary disease; FEV1, forced expiratory volume in 1 second; % pred., percentage of predicted value; VO2, pulmonary oxygen uptake.
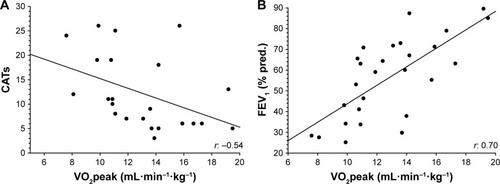
Table 3 VO2peak estimation model based on CATs in COPD patients
Table 4 VO2peak estimation model based on FEV1 (% pred.) in COPD patients
Table 5 VO2peak estimation model based on CATs and FEV1 (% pred.) in COPD patients