63
Views
3
CrossRef citations to date
0
Altmetric
Clinical Trial Report

The accuracy of a handheld “disposable pneumotachograph device” in the spirometric diagnosis of airway obstruction in a Chinese population

, , , , &
Pages 2351-2360 | Published online: 02 Aug 2018

Figures & data

Figure 1 The handheld “disposable pneumotachograph” spirometer.

Figure 1 The handheld “disposable pneumotachograph” spirometer.

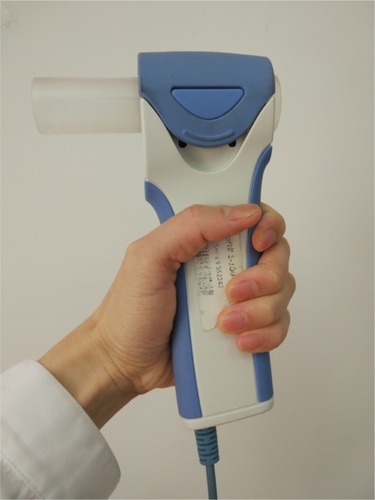
Table 1 Correlation coefficient for all indices measured (n=241)

Figure 2 Correlation of key airflow metrics between devices (n=241).

Note: Line of identity (thin solid line), line of regression (thick solid line), and 95% CIs (dotted line).
Abbreviation: FEF25%–75%, mean FEF calculated between 25% and 75% of FVC.
Figure 2 Correlation of key airflow metrics between devices (n=241).

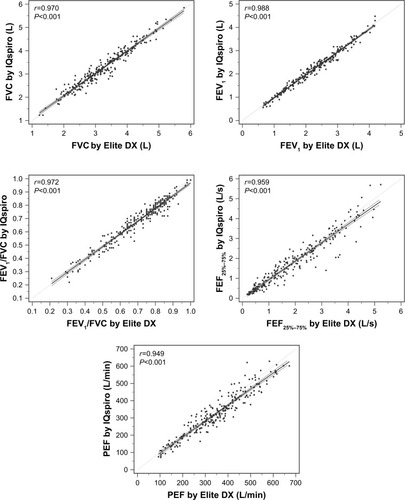
Table 2 The mean difference and 95% LoA for all parameters measured by the two spirometers (n=241)

Figure 3 Bland–Altman plot of mean differences against averages of two readings for key airflow metrics (n=241).

Notes: The 95% limits of agreement (LoA) are expressed as mean differences (d¯)±1.96 SD; the upper limit of agreement (UL) is d¯+1.96 SD, and the lower limit of agreement (LL) is d¯1.96 SD. Line of mean difference (solid line), lines of 95% LoA (dashed line), and zero line (dotted line).
Abbreviation: FEF25%–75%, mean FEF calculated between 25% and 75% of FVC.
Figure 3 Bland–Altman plot of mean differences against averages of two readings for key airflow metrics (n=241).

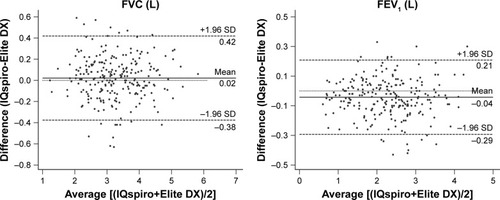
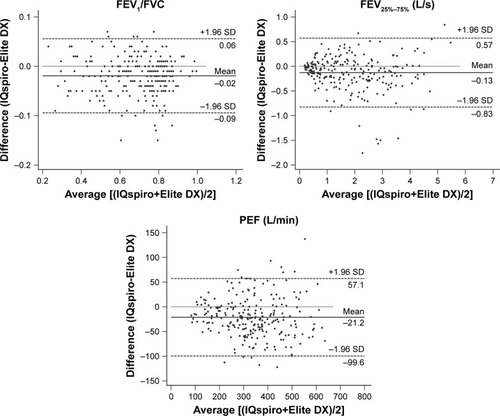
Table 3 Spirometric classification of severity of airway obstruction by two spirometers for all enrolled subjects (n=241)

Table 4 Spirometric classification of airway obstruction by two spirometers for individuals able to exhale for at least 6 seconds (FEV1/FEV6 <74%) (n=159)

Figure 4 The receiver operating characteristic curve that discriminates the optimal cutoff value of FEV1/FEV6 measured using the IQspiro (n=159).

Notes: (A) The sensitivity and specificity when the FEV1/FEV6 was <74%. (B) The sensitivity and specificity when the FEV1/FEV6 was <70%.
Figure 4 The receiver operating characteristic curve that discriminates the optimal cutoff value of FEV1/FEV6 measured using the IQspiro (n=159).

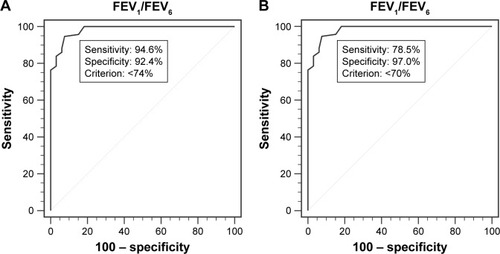
Table 5 Spirometric classification of airway obstruction by two spirometers for individuals able to exhale for at least 6 seconds (FEV1/FEV6 <70%) (n=159)