Figures & data
Table 1 Characteristics of case–control studies included in the meta-analysis
Table 2 Distributions of ACE allele and genotypes in different studies’ susceptibility to COPD
Figure 1 The flow diagram of included and excluded studies.
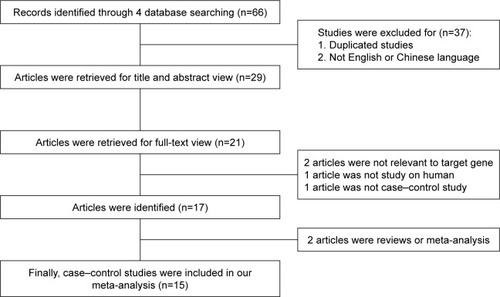
Table 3 Summary of total results and subgroup analysis from different comparative genetic models
Figure 2 Overall results of association between ACE gene polymorphism and COPD risk (DD+DI vs II).
Abbreviations: ACE, angiotensin-converting enzyme; OR, odds ratio.
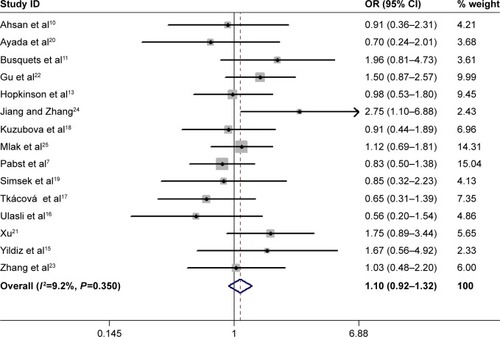
Figure 3 Sensitivity analysis for the association between the ACE polymorphism and COPD risk.
Abbreviation: ACE, angiotensin-converting enzyme.
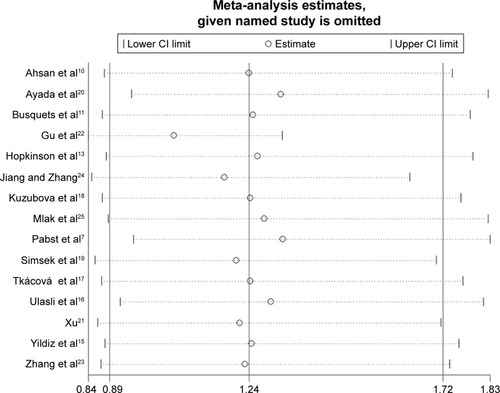
Figure 4 Forest plot for the association between ACE and COPD risk in dominant genetic model (DD+DI vs II).
Abbreviations: ACE, angiotensin-converting enzyme; OR, odds ratio.
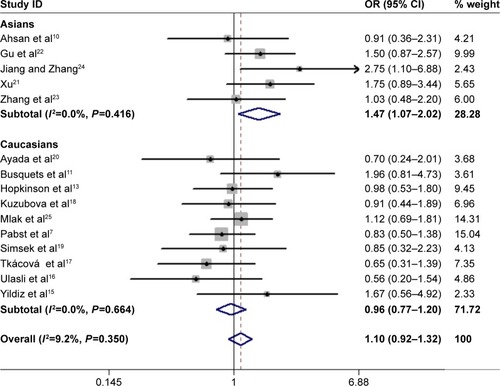
Figure 5 Forest plot for the association between ACE and COPD risk in recessive genetic model (DD vs DI+II).
Note: Weights are from random-effects analysis.
Abbreviations: ACE, angiotensin-converting enzyme; OR, odds ratio.
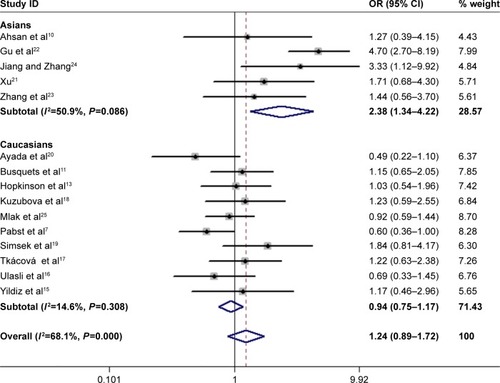
Figure 6 Forest plot for the association between ACE and COPD risk in codominant genetic model (DD vs II).
Abbreviations: ACE, angiotensin-converting enzyme; OR, odds ratio.
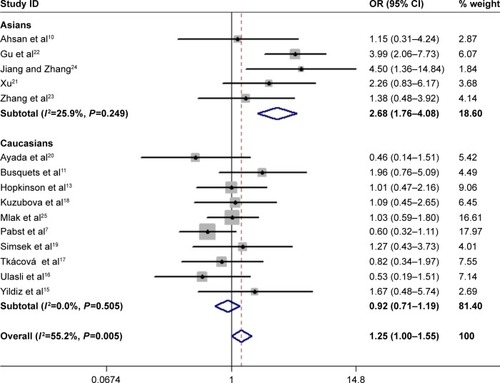
Figure 7 Forest plot for the association between ACE and COPD risk in allele genetic model (D vs I).
Note: Weights are from random-effects analysis.
Abbreviations: ACE, angiotensin-converting enzyme; OR, odds ratio.
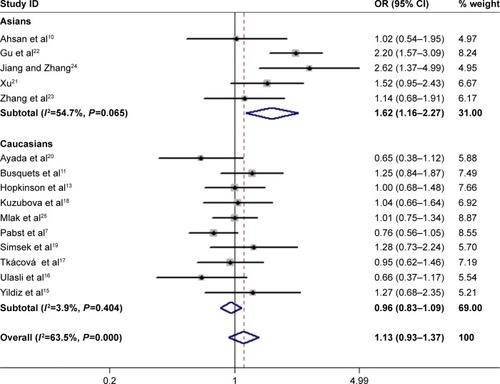
Figure 8 Funnel plot to test publication bias of studies under the dominant model (DD+DI vs II).
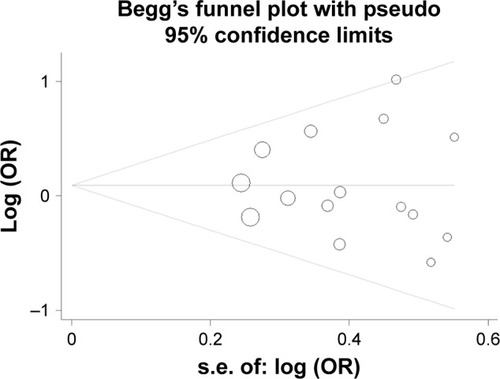
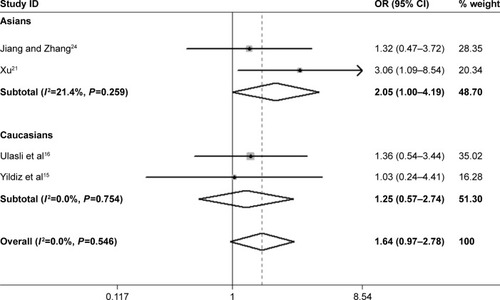
Figure 9 Forest plot for the association between ACE and PH risk under recessive genetic model (DD vs DI+II).