
Figures & data
Table 1 Demographics of COPD subjects
Figure 1 Effects of 1 hour’s pretreatment with fluticasone propionate or budesonide on phagocytosis of beads or bacteria at 1 hour and 4 hours.
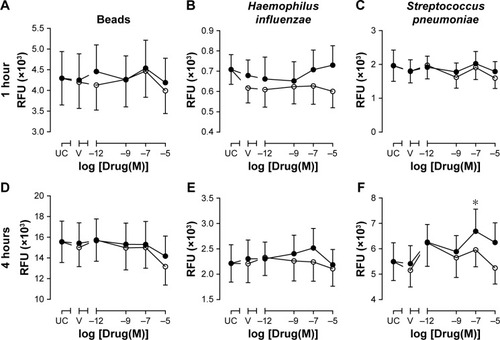
Figure 2 Effects of 18 hours’ pretreatment with fluticasone propionate or budesonide on phagocytosis of beads or bacteria at 1 hour and 4 hours.
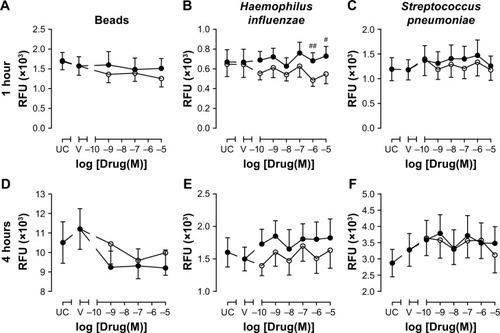
Figure 3 Effects of 1 hour’s pretreatment with fluticasone propionate or budesonide on release of CXCL8, IL6, and TNFα induced by phagocytosis of beads or bacteria at 4 hours.
Notes: (A–C) Monocyte-derived macrophages from COPD patients (n=12) were left not treated (NT), or pretreated for 1 hour with drug vehicle (V) prior to incubation with fluorescently labeled beads, Haemophilus influenzae (HI), or Streptococcus pneumoniae (SP) bacteria for 4 hours. Supernatants were analyzed by ELISA for CXCL8 (A), IL6 (B), and TNFα (C) release. Data are mean ± SEM; **P<0.01, ***P<0.001 between no treated (NT) and treatment. (D–L) Monocyte-derived macrophages from COPD patients (n=12) were pretreated for 1 hour with fluticasone propionate (○) or budesonide (●) at indicated concentrations or drug vehicle (V) prior to incubation with fluorescently labeled beads or bacteria for 4 hours. Supernatants were analyzed by ELISA for CXCL8, IL6, and TNFα release. Data are percentage responses compared to vehicle control, expressed as mean ± SEM; *P<0.05, **P<0.01 between drugs and vehicle (V).
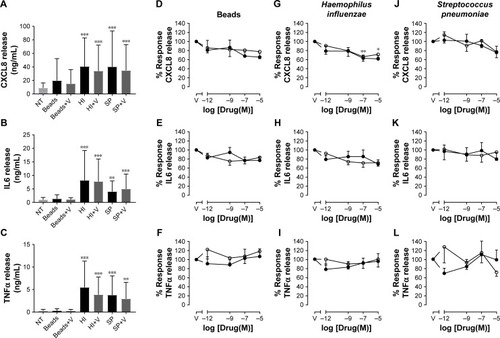
Figure 4 Effects of 18 hour's pretreatment with fluticasone propionate or budesonide on release of CXCL8, IL6, and TNFα induced by phagocytosis of beads or bacteria at 4 hours.
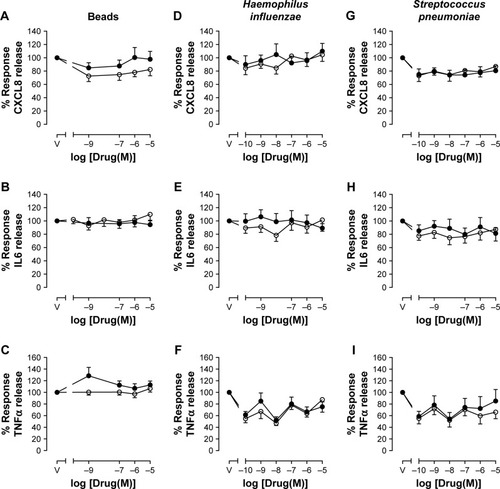
Table 2 Effects of 1 hour’s pretreatment with fluticasone propionate or budesonide on scavenger-receptor expression
Figure 5 Effects of fluticasone propionate or budesonide on intracellular killing of Haemophilus influenzae or Streptococcus pneumoniae by MDMs from COPD patients.
Abbreviation: MDMs, monocyte-derived macrophages.
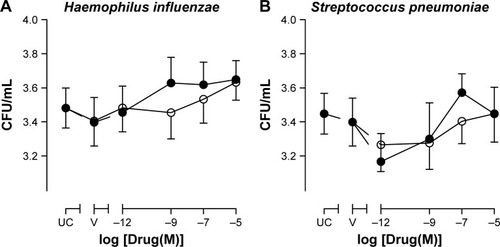
Figure S1 Effects of fluticasone propionate or budesonide on viability of MDMs after phagocytosis.
Notes: MDMs from COPD patients (n=20–24) were untreated (UC [untreated control]), or pretreated for 1 hour (A–F) or 18 hours (G–L) with fluticasone propionate (○), budesonide (●), or drug vehicle (V) prior to incubation with fluorescently labeled beads or bacteria for 1 hour or 4 hours. Cell viability was measured by MTT assay. Data presented as percentage viability compared to UC and shown as mean ± SEM; *P<0.05 between UC and drug.
Abbreviation: MDMs, monocyte-derived macrophages.
![Figure S1 Effects of fluticasone propionate or budesonide on viability of MDMs after phagocytosis.Notes: MDMs from COPD patients (n=20–24) were untreated (UC [untreated control]), or pretreated for 1 hour (A–F) or 18 hours (G–L) with fluticasone propionate (○), budesonide (●), or drug vehicle (V) prior to incubation with fluorescently labeled beads or bacteria for 1 hour or 4 hours. Cell viability was measured by MTT assay. Data presented as percentage viability compared to UC and shown as mean ± SEM; *P<0.05 between UC and drug.Abbreviation: MDMs, monocyte-derived macrophages.](/cms/asset/0cd7e3ed-26b0-45ba-92ba-cad83e9d6b64/dcop_a_169337_sf0001_b.jpg)
Figure S2 Flow cytometry gating strategy.
Notes: (A–H) Monocyte-derived macrophages were gated by the forward-scatter (FSc) vs side-scatter (SSc) population. Negative expression was gated on untreated population (red) or secondary antibody (MARCO), and a shift to the right indicates positive expression of receptors. Graphs show untreated cells (blue), H. influenzae-positive cells (light green), and cells treated with fluticasone propionate (orange), budesonide (dark green), and vehicle control (pink).
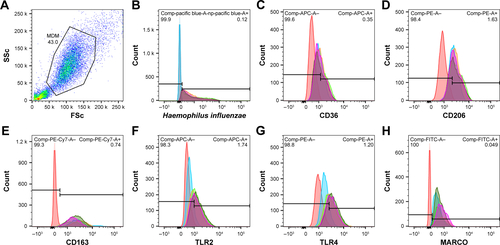
Figure S3 Effects of fluticasone propionate or budesonide on percent phagocytosis of Haemophilus influenzae and Streptococcus pneumoniae by COPD neutrophils.
Notes: Neutrophils from COPD patients were pretreated with fluticasone propionate (○) or budesonide (●) at indicated concentrations or drug vehicle (V) for 1 hour and subsequently incubated with H. influenzae (A–D) or S. pneumoniae (E–H) for 5, 10, 15, or 60 minutes, cells washed, fixed in 4% paraformaldehyde, and fluorescence measured by flow cytometry. Graphs show percentage of neutrophils that phagocytosed bacteria. Data shown as mean ± SEM with no statistical differences observed; n=7.
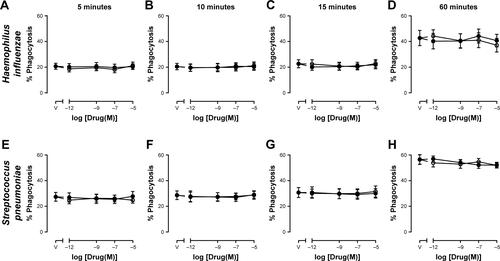
Figure S4 Effects of fluticasone propionate or budesonide on amount of Haemophilus influenzae and Streptococcus pneumoniae phagocytosed by COPD neutrophils.
Notes: Neutrophils from COPD patients were pretreated with fluticasone propionate (○) or budesonide (●) at indicated concentrations or drug vehicle (V) for 1 hour and subsequently incubated with H. influenzae (A–D) or S. pneumoniae (E–H) for 5, 10, 15, or 60 minutes, cells washed, fixed in 4% paraformaldehyde, and fluorescence measured by flow cytometry. Graphs show the amount of phagocytosed bacteria expressed as median fluorescence intensity (MFI). Data shown as mean ± SEM with no statistical differences observed; n=7.
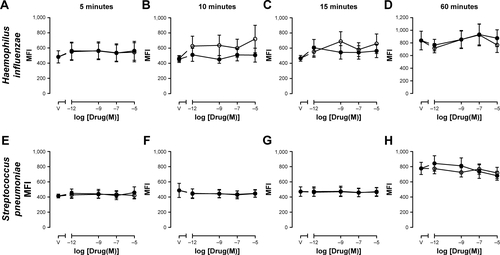
Table S1 Effects of 18 hours’ pretreatment with fluticasone propionate (FP) or budesonide (Bud) on scavenger-receptor expression