
Figures & data
Figure 1 Patient disposition, including numbers of patients included in the initial matched-pairs analysis and those included in the subsequent analyses by prior COPD maintenance therapy.
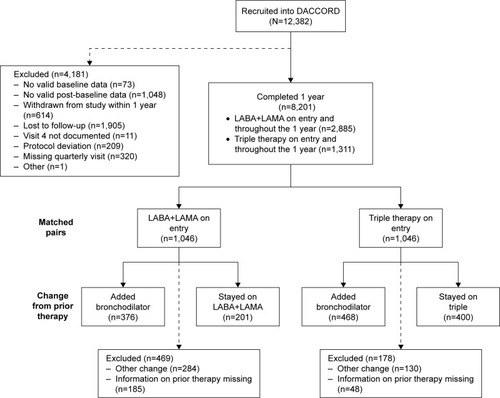
Figure 2 Prior therapy, according to post-baseline treatment group in the matched-pair analysis (n=2,092).
Abbreviations: ICS, inhaled corticosteroid; LA BA, long-acting β2-agonist; LA MA, long-acting muscarinic antagonist.
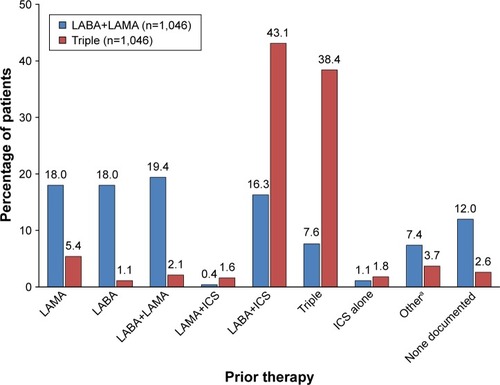
Table 1 Baseline demographics and disease characteristics of patients subgrouped according to prior therapy
Figure 3 Percentage of patients reporting exacerbations over the 1-year follow-up in patients subgrouped according to prior therapy.
Abbreviations: LA BA, long-acting β2-agonist; LA MA, long-acting muscarinic antagonist.
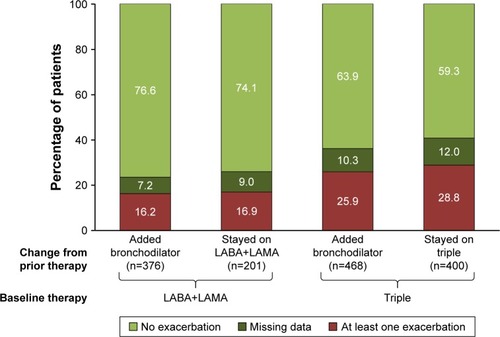
Figure 4 Annualized moderate and severe exacerbation rates in patients subgrouped according to prior therapy.
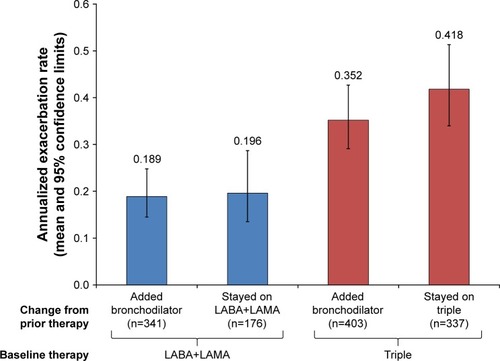
Table 2 CAT total score at month 12 – change from baseline in total score and responder analysis in patients subgrouped according to prior therapy
Table S1 Baseline demographics and disease characteristics of patients, overall and in the matched-pairs analysis