Figures & data
Table 1 Population characteristics (data reported as mean or median with SD or interquartile range where appropriate)
Figure 1 Study flow chart.
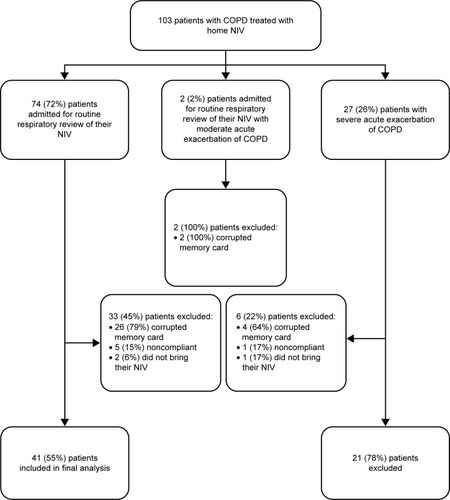
Table 2 Vital observations, arterial blood gas, and venous sample at admission for patients with severe AECOPD (n=21)
Table 3 Comparison of mean and SD values over the 10 days prior to admission in the stable group and in the group with severe AECOPD
Figure 2 Change in the 10 days preceding admission (A) change in respiratory rate, (B) change in daily compliance, (C) change in triggered breath, (D) change in tidal volume on NIV, (E) change in unintentionnal leaks, (F) change in residual events (mean value per day for each parameter).
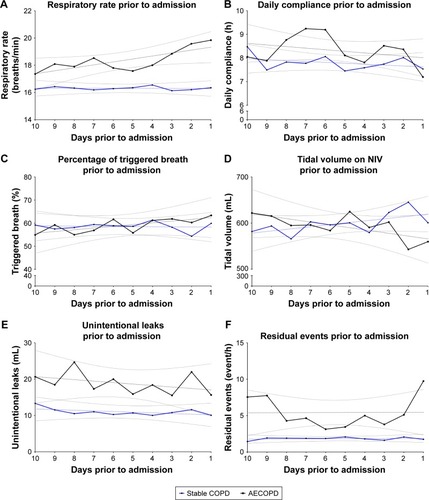
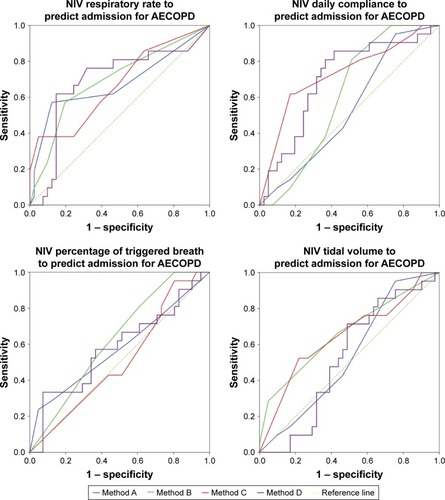
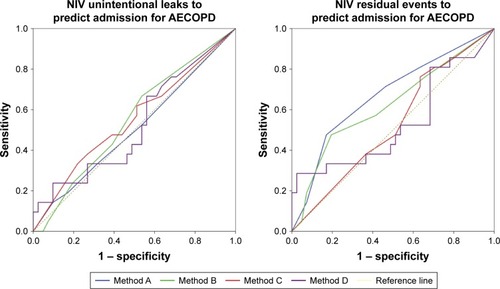
Table 4 Performance of parameters recorded by ventilator to predict severe AECOPD
Figure 3 Receiving operator curves for the prediction of admission for AECOPD for each ventilator parameter according to methods A, B, C, and D.