Figures & data
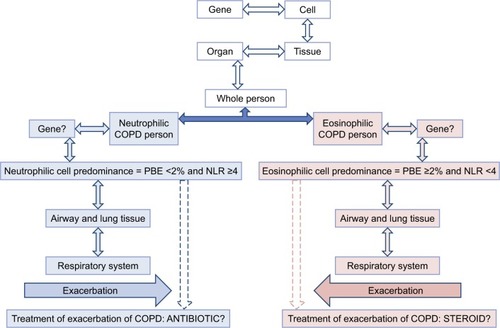
Figure 1 Flowchart of patient data.
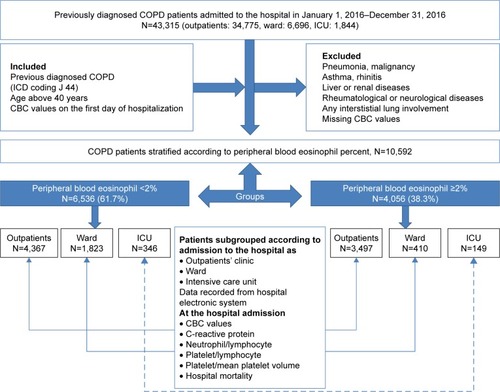
Table 1 Baseline characteristics of neutrophilic and eosinophilic acute exacerbation of COPD
Table 2 Comparison of inflammatory markers in neutrophilic and eosinophilic COPD exacerbation
Table 3 Comparison of inflammatory markers in AECOPD patients on the day of admission to the ICU, ward, or outpatients’ clinic
Table 4 Area under the curve of inflammatory markers in patients with AECOPD who died in the hospital
Figure 2 ROC curves of inflammatory markers for mortality of hospitalized COPD acute exacerbation patients.
Abbreviations: ROC, receiver operating characteristic; PLR, platelet to lymphocyte ratio; PLT/MPV, platelet/mean platelet volume; CRP, C-reactive protein; NLR, neutrophil to lymphocyte ratio.
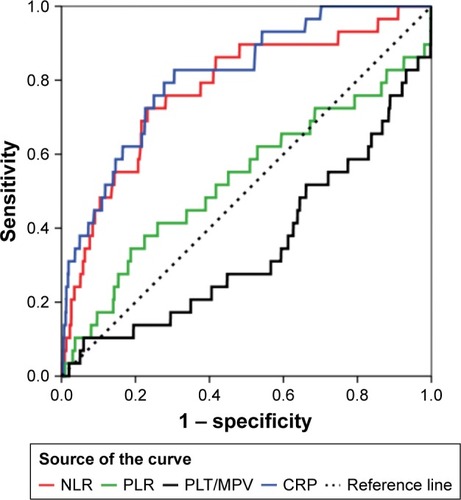
Table 5 The cutoff values of inflammatory markers in patients with AECOPD who died in the hospital
Figure 3 A treatment approach for chronic obstructive pulmonary diseases with respect to endotypes.