Figures & data
Figure 1 Flowchart of patient selection process.
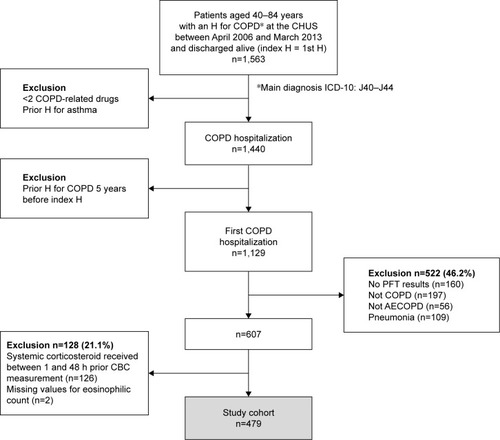
Table 1 Patients’ characteristics by eosinophilic group (≥200 cells/mL or ≥2%)
Table 2 Association between eosinophilia and 1-year COPD-related readmission according to eosinophilia definition
Figure 2 Kaplan-Meier curves for time until first COPD-related readmission: eosinophilic (red line) vs non-eosinophilic patients (blue line).
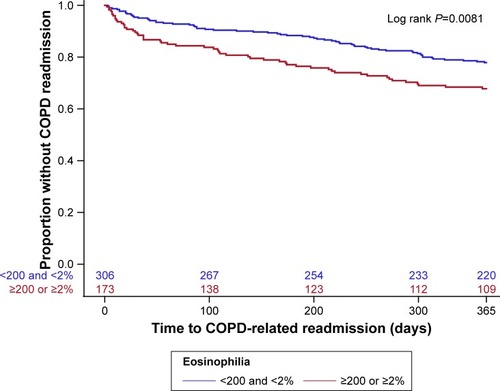
Table 3 Association between eosinophilia (≥200 cells/mL or ≥2%) and secondary outcomes
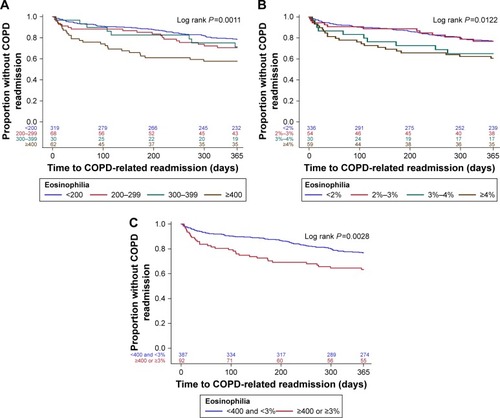
Figure 3 (A) Kaplan-Meier curves for time before first COPD-related readmission in patients with a corticosteroid-free CBC, with eosinophil counts <200 cells/μL (n=319, blue line) vs 200–299 cells/μL (n=68, red line) vs 300–399 cells/μL (n=30, green line) vs ≥400 cells/μL (n=62, brown line); follow-up 365 days post-discharge, data censored for death; P=0.0011. (B) Kaplan-Meier curves for time before first COPD-related readmission in patients with a corticosteroid-free CBC, with eosinophil counts <2% of WBC count (n=336, blue line) vs 2%–3% of WBC counts (n=54, red line) vs 3%–4% of WBC counts (n=30, green line) vs ≥4% of WBC counts (n=59, brown line); follow-up 365 days post-discharge, data censored for death; P=0.0122. (C) Kaplan-Meier curves for time before first COPD-related readmission in patients with a corticosteroid-free CBC, with eosinophil counts ≥400 cells/µL and/or ≥3% of WBC count (n=92, red line) vs eosinophil counts <400 cells/µL and <3% of WBC count (n=387, blue line); follow-up 365 days post-discharge, data censored for death; P=0.0028.