Figures & data
Table 1 Demographic characteristics and comorbidities in the MT population, 2012–2015
Figure 1 Proportions of patients in subgroups of clinical interest* for the calendar years 2012 (A), 2013 (B), 2014 (C), and 2015 (D).
Abbreviation: MT, maintenance therapy.
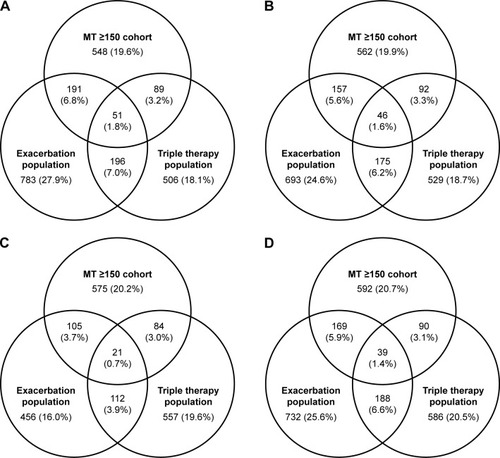
Table 2 Annual all-cause health care resource utilization by blood eosinophil count cohort (2012–2015)
Figure 2 COPD-related health care resource utilization by blood eosinophil count cohort for years 2012–2015.
Abbreviation: ER, emergency room.
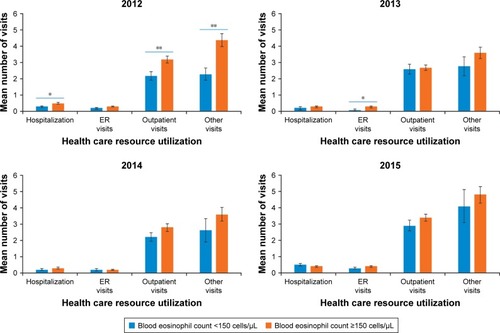
Figure 3 Multivariate analysis of COPD-related and all-cause annual medical costs for patients with blood eosinophil counts <150 cells/µL and ≥150 cells/µL, either with exacerbations (A) or without exacerbations (B).
Abbreviations: BMI, body mass index; CCI, Quan-Charlson comorbidity index.
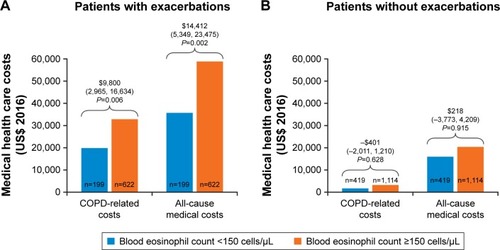
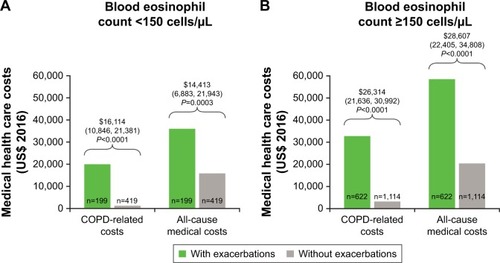
Figure 4 Multivariate analysis of COPD-related and all-cause annual medical costs for patients with and without exacerbations, with either blood eosinophil count <150 cells/µL (A) or ≥150 cells/µL (B).
Abbreviations: BMI, body mass index; CCI, Quan-Charlson comorbidity index.