Figures & data
Table 1 Baseline characteristics of the population
Table 2 Patients’ characteristics before and after pulmonary rehabilitation
Table 3 Patients’ ultrasonographic characteristics before and after pulmonary rehabilitation
Table 4 Patients’ percentage of change of ultrasonographic measurements after pulmonary rehabilitation between “markedly improved” and “slightly improved” patients based on MCID at 6MWT
Figure 1 Correlation between Lzapp and 6MWT.
Note: Spearman rank order correlation between the change (%) of Lzapp at FRC and the change (delta meters) in 6MWD before and after PR (rho=0.49, P=0.02).
Abbreviations: Lzapp, diaphragm zone of apposition length; FRC, functional residual capacity; 6MWD, 6-minute walking distance; 6MWT, 6-minute walking test.
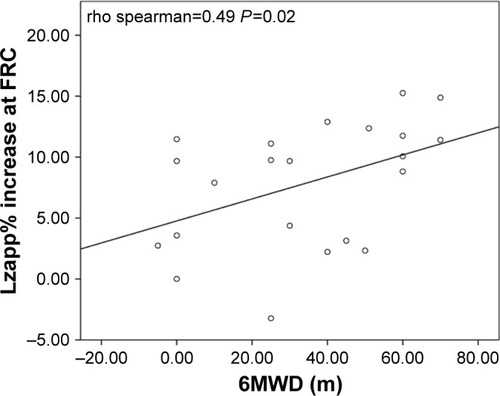
Figure 2 Difference in ΔLzapp% between patients with a minimal clinically significant difference for 6MWD after PR.
Abbreviations: Lzapp, length of diaphragm zone of apposition; FRC, functional residual capacity; 6MWD, 6-minute walking distance; 6MWT, 6-minute walking test; PR, pulmonary rehabilitation.
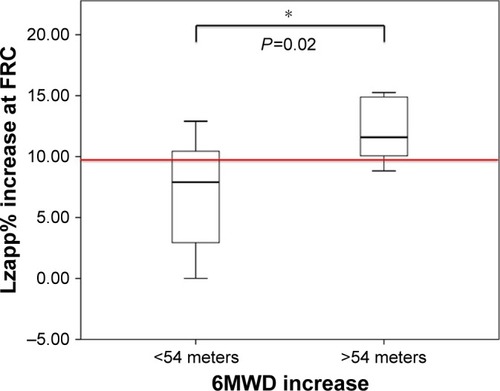
Table 5 Patients’ percentage of change of ultrasonographic measurements after pulmonary rehabilitation between “markedly improved” and “slightly improved” patients based on MCID at CAT
Figure 3 Difference in ΔLzapp% between patients with a minimal clinically significant difference for CAT after PR.
Abbreviations: Lzapp, length of diaphragm zone of apposition; FRC, functional residual capacity; CAT, COPD Assessment Test; PR, pulmonary rehabilitation.
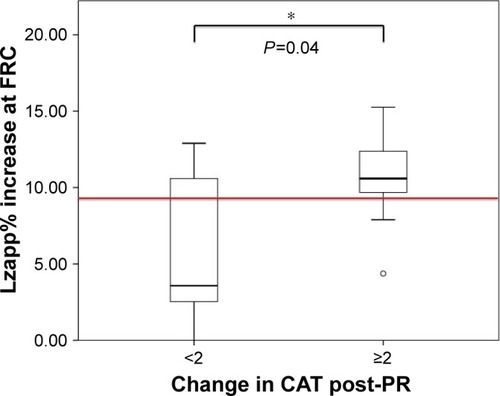
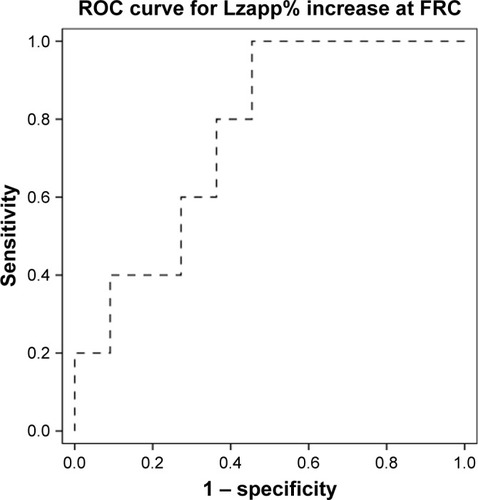
Figure 4 Receiver operating characteristic (ROC) curve for ΔLzapp% in relation to 6MWD.
Note: ROC curves estimate the ability of Lzapp change (as percentage of baseline) to predict a significant improvement in 6MWD after PR (AUC=0.83, cutoff ≥10%, sensitivity=83%, specificity=74%).
Abbreviations: AUC, area under the curve; Lzapp, length of diaphragm zone of apposition; FRC, functional residual capacity; 6MWD, 6-minute walking distance; 6MWT, 6-minute walking test; PR, pulmonary rehabilitation.
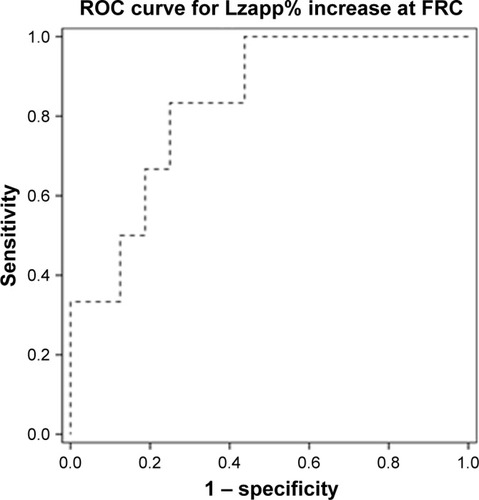
Figure 5 Receiver operating characteristic (ROC) curve for ΔLzapp% in relation to CAT.
Abbreviations: AUC, area under the curve; Lzapp, length of diaphragm zone of apposition; FRC, functional residual capacity; CAT, COPD Assessment Test; PR, pulmonary rehabilitation.