Figures & data
Figure 1 Study design.
Abbreviations: CAT, COPD Assessment Test; PEF, peak expiratory flow; SPT, skin-prick test.
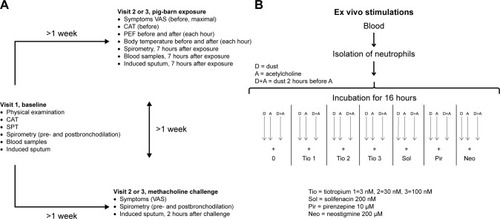
Figure 2 FVC (A) and FEV1 (B) at baseline and 7 hours after start of in vivo exposure in a pig barn in controls (healthy non-smokers) and smokers with COPD. Vertical lines indicate baseline difference between the groups and horizontal lines difference induced by exposure within each group. In vivo exposure induced decreases in FEV1 and FVC greater in the COPD group than in the healthy non-smokers (P<0.0001). (C) Change in FEV1 induced by in vivo exposure in a pig barn related to bronchial responsiveness to methacholine indicated by 20% decrease in FEV1 (PD20FEV1) in 15 healthy non-smokers and 13 smokers (methacholine challenge was not performed in two COPD patients who experienced symptoms).
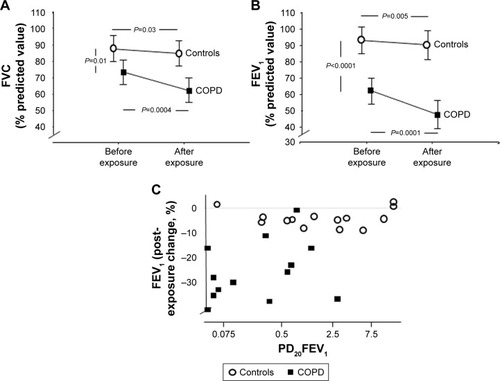
Table 1 Baseline characteristics of healthy non-smokers (controls) and smokers with COPD
Figure 3 Sputum analyses before and after in vivo exposure in COPD subjects and controls.
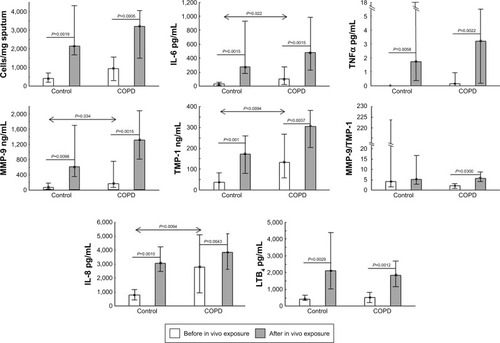
Table 2 Expression of acetylcholinesterase (AChE) and choline acetyltransferase (ChAT)
Figure 4 Blood analyses before and after in vivo exposure in a pig barn in COPD subjects and controls.
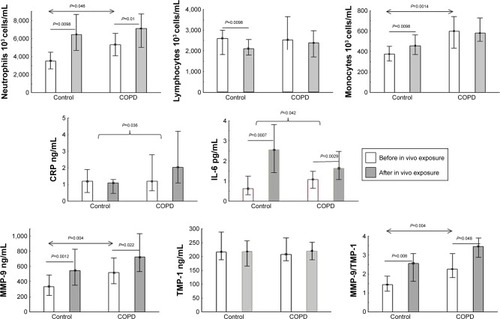
Figure 5 CXCR1, CXCR2 and ChAT expression.
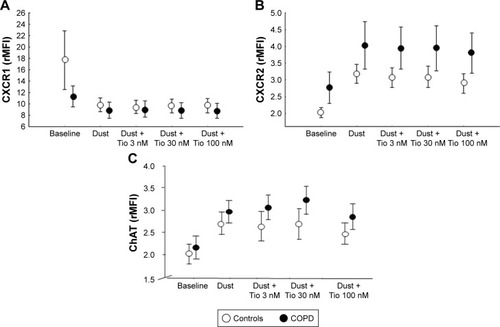
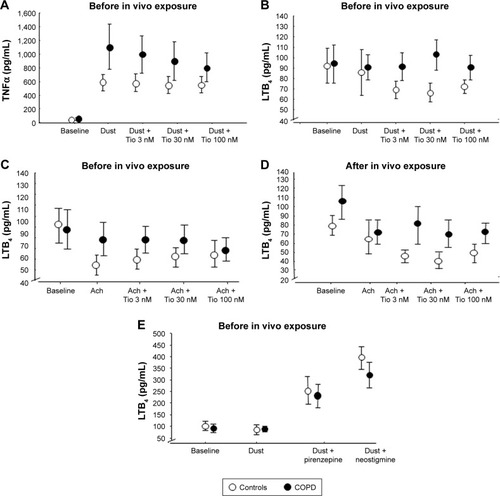
Figure 6 (A) Before in vivo exposure, the release of TNFα from isolated blood neutrophils increased following ex vivo stimulation with dust in controls (P=0.0002) and COPD (P=0.0014). A similar increase was observed in controls (P=0.0069) and COPD (P=0.0014) after in vivo exposure (data not shown). There was no difference between the groups (P≥0.20). Dust-induced TNFα release was not significantly altered by tiotropium (Tio). (B) Dust by itself did not influence LTB4 release in either group before (and after, data not shown) in vivo exposure. (C, D) Acetylcholine (Ach; 100 µM) induced a significant decrease in LTB4 release from neutrophils before in vivo exposure (C) in controls (P=0.0017) and after in vivo exposure (D) in the COPD group (P=0.0002). Tio did not significantly alter the response induced by Ach. (E) Before in vivo exposure, dust increased LTB4 release in the presence of pirenzepine in controls (P=0.0036) and COPD (P=0.0092). Similar findings were observed after in vivo exposure (P≤0.0022; data not shown). The combination of dust and neostigmine induced increased LTB4 release in controls (P=0.0008) and COPD (P=0.0003) before in vivo exposure. Similar findings were observed after in vivo exposure (P≤0.0021; data not shown). Data presented as mean (SEM).