
Figures & data
Table 1 Baseline characteristics
Figure 1 Comparisons of endobronchial optical coherence tomography (EB-OCT) parameters of the seventh to ninth generation of bronchi among never-smokers, heavy-smokers and patients with stages I–IV COPD.
Notes: The comparisons of airway inner area (A), and airway wall area percentage (B), average value (C), average value (D), from 7 to 9 generation of bronchi among five groups. Multiple-group comparisons were made by using one-way ANOVA. ✫Indicates a significant difference (P<0.05) between heavy-smokers and never-smokers. *Compared with never-smokers, P<0.05; ※Compared with heavy-smokers, P<0.05; §compared with stage I COPD, P<0.05; #compared with stage II COPD, P<0.05. Abbreviations: Gen 7–9, from the seventh to ninth generation bronchi; Ai, airway internal area; Aw, airway wall area; Aw%, airway wall area percentage, calculated with the formula of [Aw/(Aw + Ai)×100%]; BSA, body surface area; NS, never-smokers; SNL, heavy-smokers with normal lung function.
![Figure 1 Comparisons of endobronchial optical coherence tomography (EB-OCT) parameters of the seventh to ninth generation of bronchi among never-smokers, heavy-smokers and patients with stages I–IV COPD.Notes: The comparisons of airway inner area (A), and airway wall area percentage (B), average value (C), average value (D), from 7 to 9 generation of bronchi among five groups. Multiple-group comparisons were made by using one-way ANOVA. ✫Indicates a significant difference (P<0.05) between heavy-smokers and never-smokers. *Compared with never-smokers, P<0.05; ※Compared with heavy-smokers, P<0.05; §compared with stage I COPD, P<0.05; #compared with stage II COPD, P<0.05. Abbreviations: Gen 7–9, from the seventh to ninth generation bronchi; Ai, airway internal area; Aw, airway wall area; Aw%, airway wall area percentage, calculated with the formula of [Aw/(Aw + Ai)×100%]; BSA, body surface area; NS, never-smokers; SNL, heavy-smokers with normal lung function.](/cms/asset/70a09528-be53-4084-9805-5f29f8c72d80/dcop_a_172639_f0001_c.jpg)
Figure 2 Cross-sectional endobronchial optical coherence tomography (EB-OCT) images of the seventh, eighth, and ninth generation of bronchi.
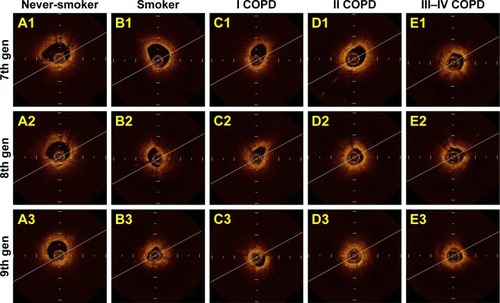
Figure 3 Comparison of impulse oscillometry (IOS) parameters in never-smokers, heavy-smokers and patients with stages I–IV COPD.
Abbreviations: Fres, resonance frequency; R5, airway resistance at 5 Hz; R20, airway resistance at 20 Hz; R5–R20, the difference between airway resistance at 5 Hz and 20 Hz; X5, pulmonary reactance at 5 Hz; AX, reactance area; Z, impedance; NS, never-smokers; SNL, smokers with normal lung function.
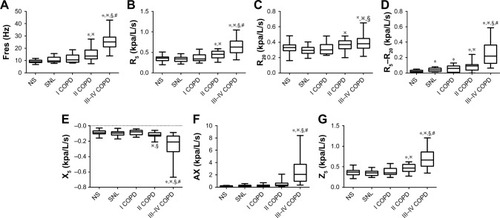
Figure 4 The diagnostic value of spirometric and impulse oscillometry (IOS) parameters in discriminating the presence from the absence of small-airway disorders in never-smokers, heavy-smokers, and patients with stage I COPD.
Abbreviations: MMEF, maximal mid-expiratory flow; Fres, resonant frequency; R5–R20, peripheral airway resistance; AUC, area under the curve; COMB, Combination of Fres, R5–R20, FEV1% and MMEF% predicted.
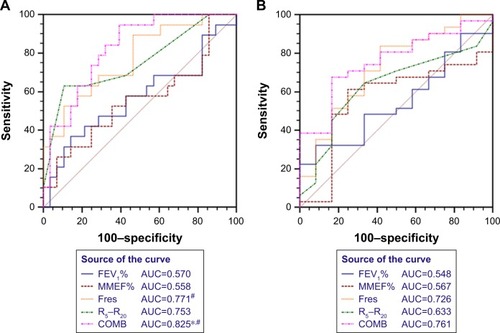
Figure 5 Correlation among FEV1% predicted, MMEF% predicted, Aw% 7–9, Fres and R5–R20 in COPD patients and heavy-smokers.
Abbreviations: MMEF, maximal mid-expiratory flow; Fres, resonant frequency; R5–R20, peripheral airway resistance; Aw%, airway wall area percentage.
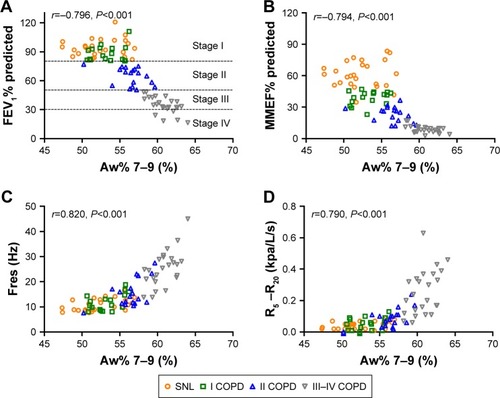
Figure S1 Bland-Altman analysis for endobronchial optical coherence tomography (EB-OCT) measurements by observer A and observer B (n=106).
Note: Bland-Altman analysis for D7–9 (A), Ai7–9 (B) and Aw7–9 (C) as measured by observer A and observer B.
Abbreviations: D7–9, mean diameter from 7th to 9th generation of bronchi; Ai7–9, airway internal area from 7th to 9th generation of bronchi; Aw7–9, airway wall area from 7th to 9th generation of bronchi.
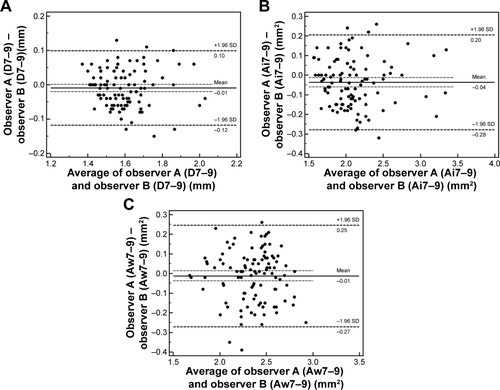
Figure S2 Receiver operating characteristic (ROC) curve analysis of endobronchial optical coherence tomography (EB-OCT) parameter for discriminating never-smokers from patients with COPD.
Notes: The diagnostic value of Aw% 7–9 for discriminating the presence from the absence of small-airway disorders in never-smokers and COPD patients (never-smokers, n=17; COPD patients, n=48) (Figure A. Data from the previous studyCitation1). The diagnostic value of Aw% 7–9 for discriminating the presence from the absence of small-airway disorders in never-smokers and COPD patients (never-smokers, n=21; COPD patients, n=59) (Figure B. Data from the current study).
Abbreviations: 7–9, from 7th to 9th generation of bronchi; Aw%, airway wall area percentage.
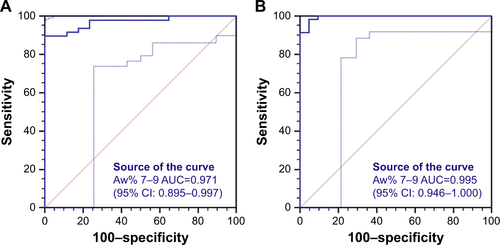
Figure S3 Incidences of small airway disorders (SADs) in never-smokers, heavy-smokers and patients with different stages of COPD.
Notes: By using cut-off value of 51% for Aw% 7–9, SADs were detected in 1/21 (4.8%) never-smokers, 17/26 (65.4%) heavy-smokers, 15/17 (88.2%) stage I, 17/18 (94.4%) stage II and 24/24 (100%) stages III–IV COPD patients.
Abbreviations: NS, never-smokers; SNL, heavy-smokers with normal lung function.
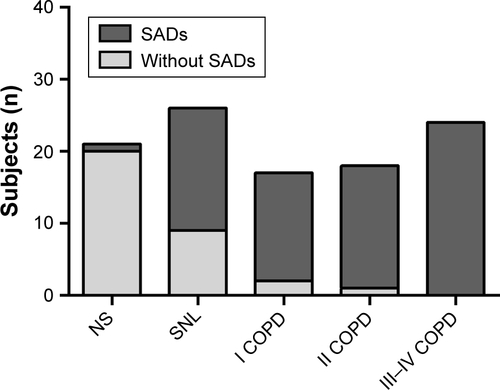
Figure S4 Partial correlation among spirometric, impulse oscillometry (IOS) and endobronchial optical coherence tomography (EB-OCT) parameters in heavy-smokers (A) and COPD patients (B).
Notes: Partial correlation analysis were performed with controlling for age and height. The color of individual boxes indicated the partial correlation coefficient of two parameters (red fillings indicated significantly positive correlation, whereas blue fillings indicated significantly negative correlation).
Abbreviations: MMEF, maximal mid-expiratory flow; 7–9, from 7th to 9th generation of bronchi; Ai, airway internal area; Aw, airway wall area; Aw%, airway wall area percentage; D, mean diameter; Fres, resonance frequency; R5, airway resistance at 5 Hz; R20, airway resistance at 20 Hz; R5–R20, the difference between airway resistance at 5 Hz and 20 Hz; X5, pulmonary reactance at 5 Hz; AX, reactance area; Z, impedance.
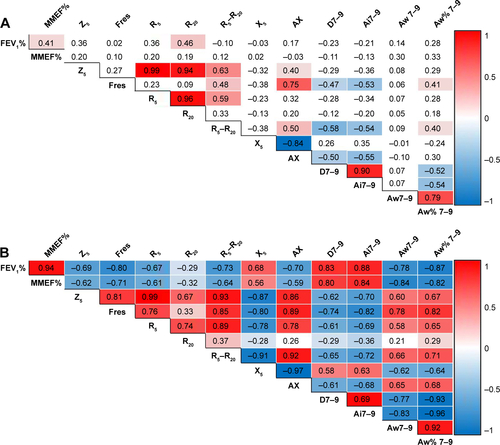
Table S1 Symptoms, treatment and comorbidities in patients with COPD
Table S2 Receiver operating characteristic curve of spirometric and IOS parameters in discriminating the presence or absence of small-airway disorders in never-smokers and heavy-smokers
Table S3 Receiver operating characteristic curve of spirometric and IOS parameters in discriminating the presence or absence of small-airway disorders in heavy-smokers and patients with stage I COPD
Table S4 Correlation between EB-OCT parameters and IOS and spirometric indices in never-smokers, heavy-smokers and different stages of COPD