
Figures & data
Figure 1 Flow chart of study participants showing excluded patients at different stages of the study.
Abbreviation: CAD, coronary artery disease.
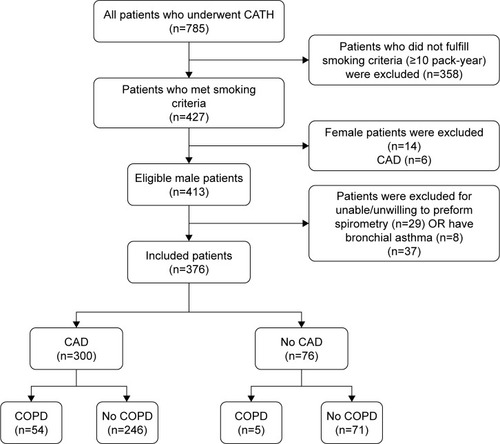
Table 1 Characteristics of the participants according to the coronary artery disease status
Table 2 Characteristics and spirometry findings of participants with chronic obstructive lung disease
Table 3 Multivariate logistic regression model for the predictors of COPD
Table 4 Spirometry findings according to therapeutic strategy of patients with coronary artery disease compared to patients without coronary artery disease